A Chromebook runs Chrome, so it has the same developer tools as Chrome on any other computer - the full Console, the Network tab, the element inspector, all of it. The only thing that makes this a question worth its own answer is the keyboard, which does not have the key most instructions tell you to press.
Somebody says “press F12” or “open the console”, and on a Chromebook there is no F12 to find. Here is how to open developer tools anyway, and what to do once they are open.
Opening developer tools
Three ways in, and the second is the one to remember because it does not depend on any key the Chromebook is missing.
- Right-click the thing you want to look at and choose Inspect. If your Chromebook has no right mouse button, tap the touchpad with two fingers. This opens developer tools with that element already selected, which is usually exactly what you wanted.
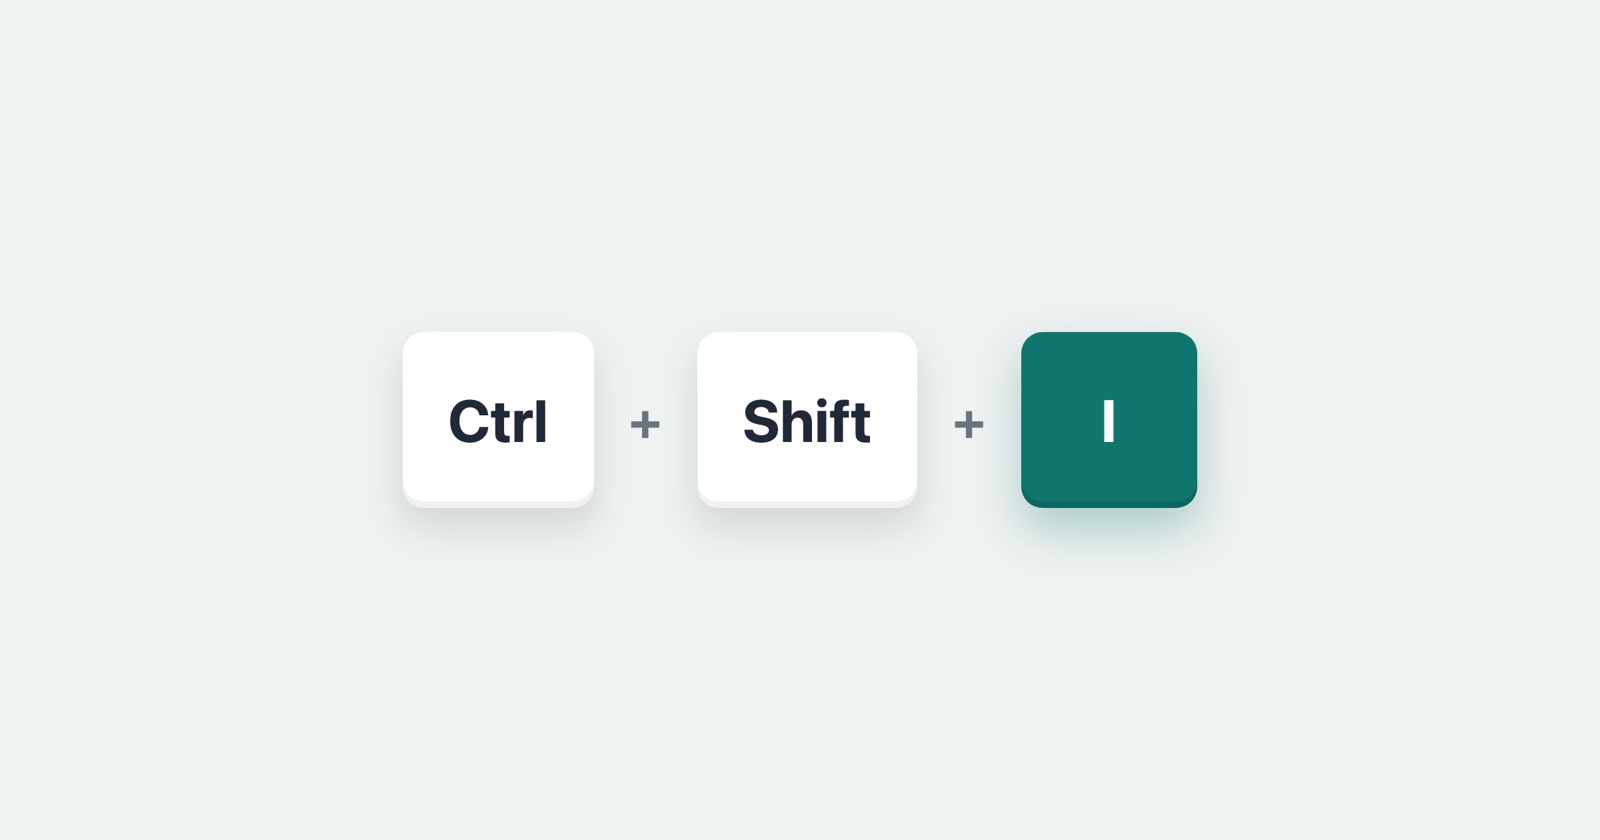
- Press Ctrl + Shift + I to open the tools. To go straight to the Console instead, press Ctrl + Shift + J. Both work on every Chromebook and are the reliable answer.
- Press the key in the top row where F12 would be, if you need it. That row is the catch, and it has its own section below.
The F12 problem, and how the top row actually works
A Chromebook’s top row is not function keys. It is back, refresh, fullscreen, brightness and the rest, and there is no F12 printed anywhere. This is the single thing people get stuck on, and it has a fix.
Hold the Launcher key - the one with a circle or a magnifying glass, where Caps Lock sits on other keyboards - and the top row becomes F1 through F12 for as long as you hold it. So Launcher + the twelfth key in the top row is F12, and it opens developer tools.
But you rarely need that, because Ctrl + Shift + I does the same job without counting keys. If an instruction says F12 and you are on a Chromebook, read it as “open developer tools” and use the shortcut instead.
The inspect keyboard shortcut, on every keyboard
If you came here for the shortcut rather than the explanation: on a Chromebook it is Ctrl + Shift + I, and that is the whole answer. The others are worth knowing because the instruction you were handed was almost certainly written for a different machine, and following it literally is what sends people hunting for a key their keyboard does not have.
- Chromebook, Windows and Linux: Ctrl + Shift + I opens developer tools, and Ctrl + Shift + J opens them with the Console already in front.
- Mac: Cmd + Option + I, and Cmd + Option + J for the Console. Safari is different again and has to be switched on before any of it works, which the Mac guide covers.
- Windows and Linux only: F12 does the same job as Ctrl + Shift + I. A Chromebook has no F12 printed on it at all, which is the section above.
Two things trip people up more often than the keys do. The shortcut opens the tools without selecting anything, so when you want one particular element, right-click it and choose Inspect instead and you arrive with that element already highlighted. And the shortcut acts on the page you are looking at rather than on the browser, so it does nothing useful on a new tab page, a settings screen or the Web Store.
If you are on Windows rather than a Chromebook, the Windows guide goes on to which panel answers which question once you are in.
Reading the Console, which is usually the point
Most of the time “inspect element on a Chromebook” is really “somebody asked me what the console says.” The Console tab is where the page reports its errors, and a red line there is often the whole explanation for a page that will not work.
Open the tools, click Console, and reload the page so it runs from the start with the console watching. Red is an error, orange is a warning. The first red line is usually the one that matters; the rest are often consequences of it. If you were asked to send what it says, the honest way is to capture the whole thing rather than retype one line, because the line under the red one is often where the real detail is.
The Network tab, for when nothing loads
If the problem is that something did not load rather than that the page threw an error, the Network tab is the place. Open it, reload, and watch the list fill with every request the page made. A red row is a request that failed, and its status code says how. The Network tab has its own guide if the panel is new to you.
Inspecting an Android phone from your Chromebook
Worth knowing, because a Chromebook is often the computer a tester actually has: it can open the
developer tools for a page running on an Android phone, over a USB cable, exactly the way a
Windows or Mac machine can. Type chrome://inspect into the address bar, connect the phone, and
the pages open on it appear in the list with an inspect link beside each. The full steps are
in how to inspect element on Android;
nothing about them changes because the computer is a Chromebook.
If you are the one asking somebody to do this
If you are guiding a person on a Chromebook through this - a tester, a customer, a colleague - do not tell them to press F12. They will look for it, not find it, and decide the instructions are wrong. Say “right-click the page and choose Inspect”, which needs no key at all, or “Ctrl + Shift + J opens the console.” Both work on the first try, which is the difference between getting an answer and getting a screenshot of the wrong screen.
Session Replay
Free Chrome extension. One click on the page that is misbehaving captures the screenshot, the console and the network log, and hands you a link to paste into the ticket.
Because it runs in Chrome, it runs on a Chromebook, and it captures the console and the network log for whoever gets the report - so the person on the Chromebook does not have to find a key that is not there before they can tell you what went wrong.
Quick reference
- Open developer tools: right-click and Inspect, or Ctrl + Shift + I.
- Open straight to the Console: Ctrl + Shift + J.
- If you truly need F12: hold the Launcher key and press the twelfth key in the top row.
-
Inspect an Android phone:
chrome://inspectwith the phone on a cable.