Every explanation of this error tells you the same true and useless thing: a function called itself too many times, so add a base case.
You knew that. What you want to know is which call started it, and this is the one error in JavaScript whose stack trace structurally cannot tell you.
Everything measured below was run in Chrome. The numbers are V8’s; the shape holds in any engine that captures a stack at the moment of the throw.
What the trace actually contains
Take a chain where one function calls another, which calls a third, which starts recursing, and catch the error:
function entryPoint() { return level1() }
function level1()     { return level2() }
function level2()     { return recurse(0) }
function recurse(n)   { return recurse(n + 1) }

try { entryPoint() } catch (e) { console.log(e.stack) }
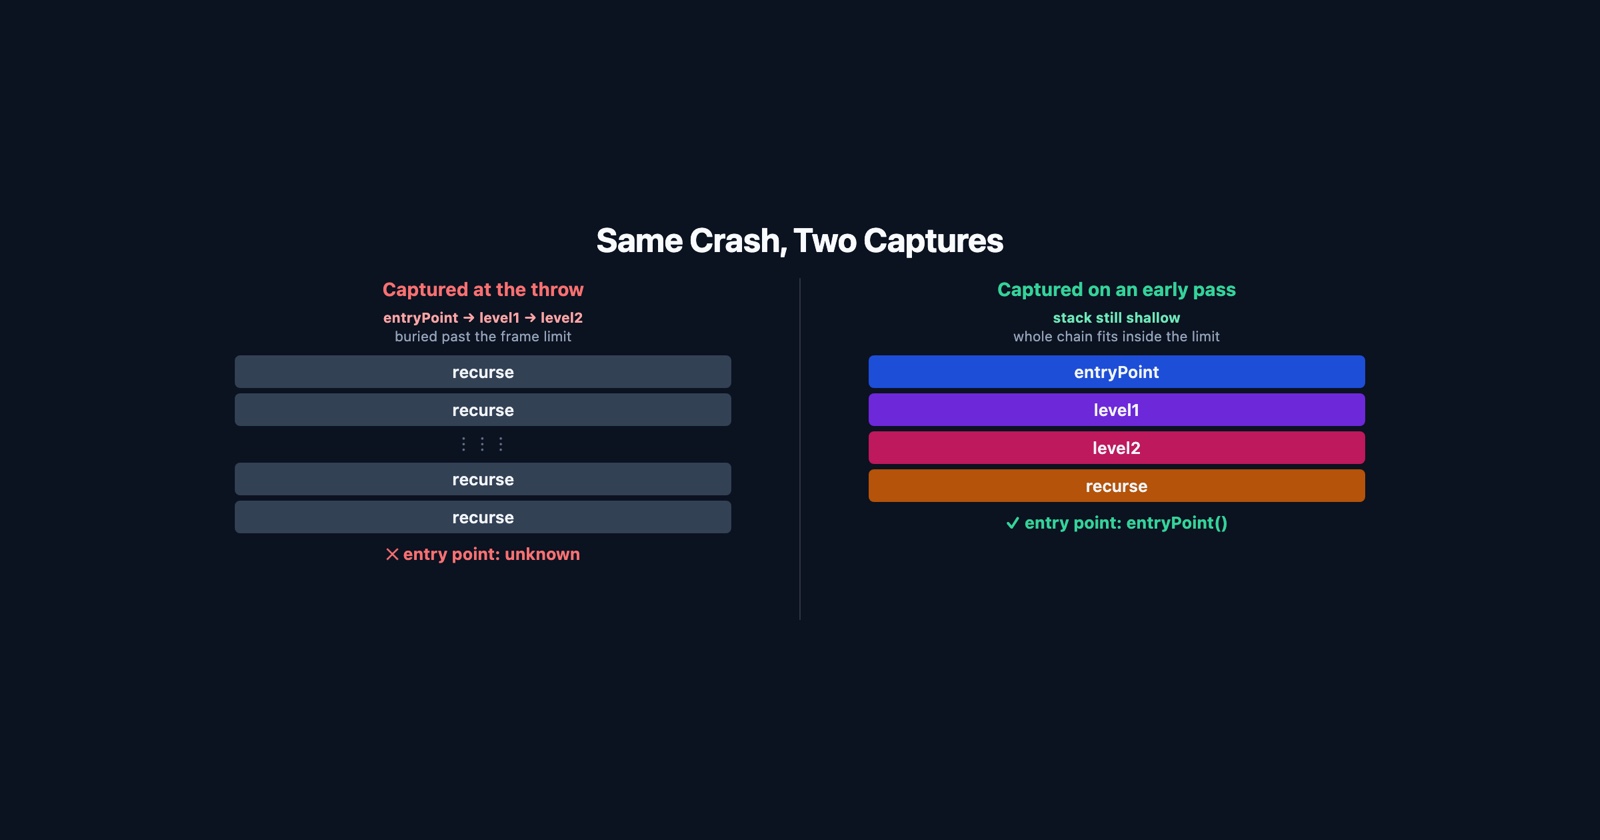
RangeError: Maximum call stack size exceeded, and then ten lines, every one of them recurse:
RangeError: Maximum call stack size exceeded
    at recurse (<anonymous>:2:145)
    at recurse (<anonymous>:2:156)
    at recurse (<anonymous>:2:156)
    ... seven more identical lines
entryPoint is not in it. Neither is level1 or level2. The trace names the function you
already knew about, ten times, and nothing else.
Ten, because Error.stackTraceLimit defaults to 10.
Raising the limit does not help, and this is the part worth knowing
The obvious move is to ask for more frames:
Error.stackTraceLimit = 200;
Do that and you get 200 lines. Measured on the chain above, all 200 are recurse, and
entryPoint is still absent.
The reason is where the trace is captured from. It is taken at the moment of the throw, which is the deepest point of the stack, and it walks back from there. Your entry point is at the other end, thousands of frames away. Asking for 200 frames gets you 200 frames from the wrong end.
This is why “read the stack trace bottom to top”, which is the right instruction for
almost every other error,
fails here. The bottom of this trace is recurse as well.
Capture it early instead, and the window is narrow
The information you want exists. It is just only available while the stack is still shallow.
So capture a trace from inside the recursing function, on an early pass, and throw the error away:
function recurse(n) {
  if (n === 2) console.log(new Error("where did this start").stack);
  return recurse(n + 1);
}
On the chain above, that trace ends:
    at level2 (<anonymous>:4:27)
    at level1 (<anonymous>:4:27)
    at entryPoint (<anonymous>:3:31)
Which is the answer. The whole chain, in order, from the call that started it.
The window is about as wide as your frame limit, and that is the catch. Capturing at depth 2
gives the entry point. Capturing at depth 20, with the limit still at its default 10, does not,
because by then the ten frames the trace will hold have all been pushed past the start. So the two
moves work together and neither works alone: raise Error.stackTraceLimit, and capture on an
early pass.
If you do not know which function is recursing, the error does tell you that much. It is the name repeated ten times.
The version that arrives in a ticket
All of the above needs you at the keyboard while it happens. Consider what reaches you when it happens to somebody else.
The page froze, or went blank, or a button stopped responding. If they opened the console and photographed it, you have ten identical lines naming a function. That image contains no information about which code path ran, which is the only thing you need.
This makes stack overflow unusual among browser errors. For most faults the console is the artefact worth asking for, and for this one it is close to worthless: ten copies of a fact you could have guessed. What actually narrows it is the sequence of actions immediately before the freeze, because the entry point is a thing the user did.
Which is an uncomfortable inversion. The error with the most console output is the error where console output helps least, and where what the person was doing matters most.
Session Replay
Free Chrome extension. One click on the page that is misbehaving captures the screenshot, the console and the network log, and hands you a link to paste into the ticket.
What to take from it
The error is honest and nearly content-free: something recursed without stopping. It names the function at the bottom of the loop and withholds the one at the top, not out of stinginess but because of where a stack trace is taken from.
So stop reading the trace, and go and get a different one, from an early pass, with the limit raised. Or, when it is somebody else’s browser, stop asking for the console and ask what they pressed.