Core Web Vitals are three numbers, and almost everything written about them explains what they measure. The more useful question is whose experience they measure, because the answer is in the definition and it decides what you can conclude from a green score.
The three, and the one that is gone
Google’s own thresholds, in three bands each:
- Largest Contentful Paint (LCP): Good 2500 ms or less, Needs improvement 2501 to 4000 ms, Poor over 4000 ms.
- Interaction to Next Paint (INP): Good 200 ms or less, Needs improvement 201 to 500 ms, Poor over 500 ms.
- Cumulative Layout Shift (CLS): Good 0.1 or less, Needs improvement 0.11 to 0.25, Poor over 0.25.
LCP is loading: how long until the biggest thing on the screen arrives. INP is interactivity: you touch something, and how long before the page paints a response. CLS is visual stability, and it is the only one that is not a duration; it is a score for how much the layout moved after you could already see it.
First Input Delay is no longer one of them. INP replaced FID and became stable in 2024, which matters mainly because any guide written before that names a metric that is not measured any more. If somebody hands you a performance report with an FID column, it is telling you about a different web.
Which of them a visitor can feel
This is the part worth having, because a user never reports a metric. They report a sensation, and the sensation tells you which of the three to look at.
“I sat there looking at nothing.” That is LCP. The page was reached, the server answered, and the thing the person came for had not arrived. Nothing is broken and nothing errors.
“I tapped it and nothing happened, so I tapped it again.” That is INP, and the second tap is the diagnostic half. A page that does not paint a response within a couple of hundred milliseconds gets pressed twice, which is how one intended action becomes two submitted ones.
“It jumped and I hit the wrong thing.” That is CLS. A late image or a web font arriving after first paint pushes the button somewhere else between the eye deciding and the finger landing.
So “the site feels slow” is at least three different defects, and the words somebody chooses narrow it before you have measured anything. That is worth more than it sounds, because the three have nothing in common underneath: LCP is usually bytes and round trips, INP is usually JavaScript occupying the main thread, and CLS is usually layout you did not reserve space for.
The 75th percentile is the whole story
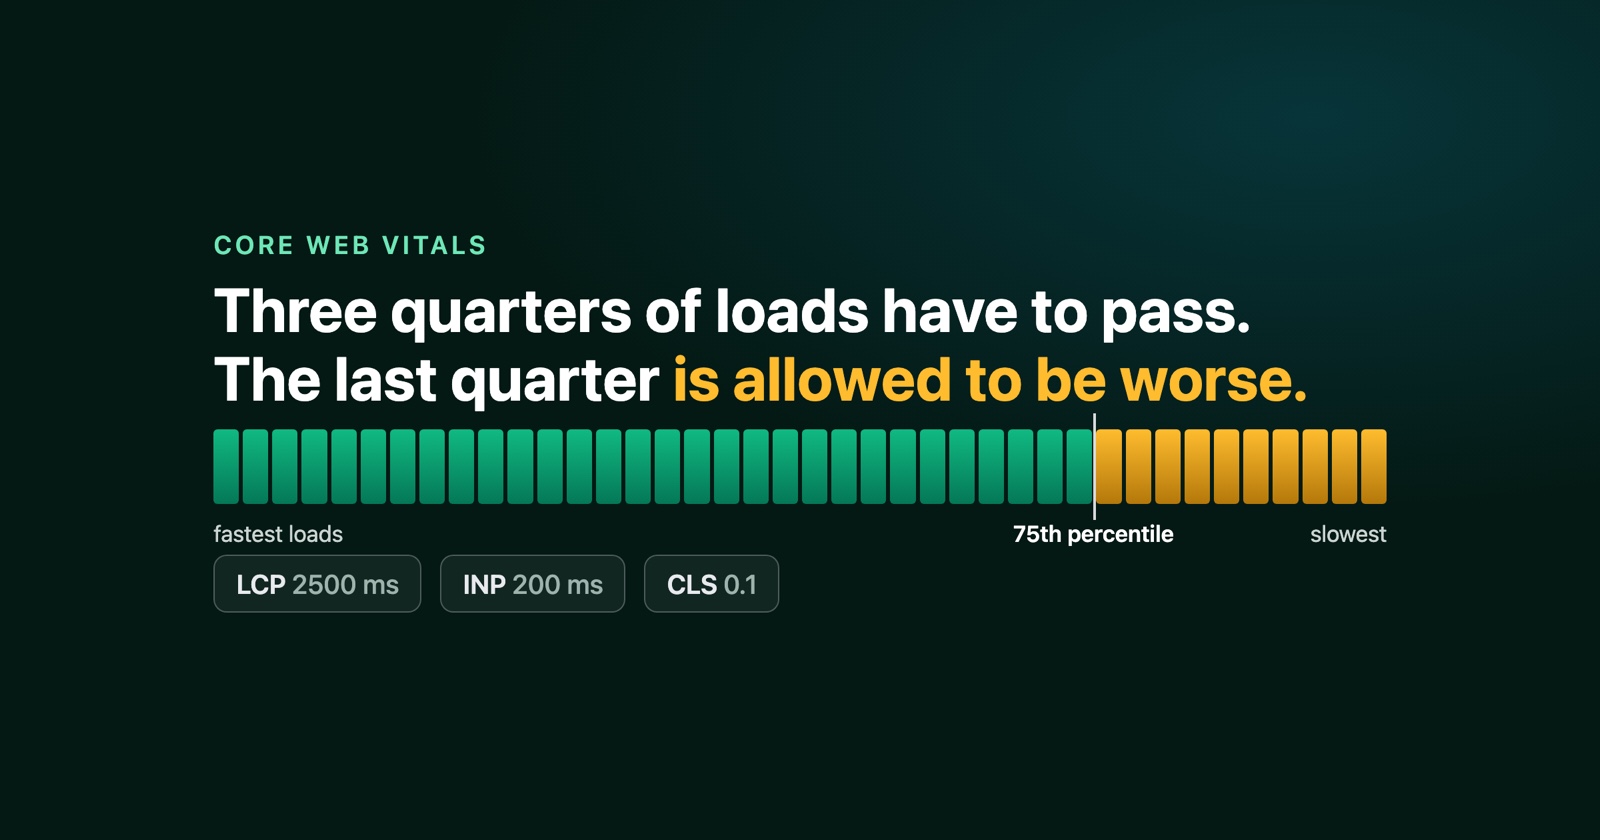
Here is the sentence that changes how you read a score. The assessment is made at the 75th percentile of page loads, segmented across mobile and desktop devices.
Not the average, and not your visit. Three quarters of loads have to be at or under the threshold for a page to pass, which means one load in four is allowed to be worse than your green number while the number stays green. That is not a flaw in the metric; it is what the metric says.
Google’s reasoning for choosing that percentile is published and worth knowing, because it explains why the tail is deliberate: the 75th ensures a majority of visits experienced the target level of performance, while higher percentiles give undue weight to sporadic bad experiences. With one hundred visits, moving the bar to the 75th percentile requires twenty-five of them to be affected before the score moves. At the 95th it takes five.
So the design decision is to be robust against outliers. The cost of that robustness is that a real, repeatable problem affecting a fifth of your visitors can sit underneath a passing score indefinitely.
Why your own experience is never the measurement
Open your own site and you are almost certainly in the comfortable three quarters, and not by luck. You are on a machine chosen for development work, on a connection you pay for, with the cache already warm, the fonts already downloaded and the service worker already installed, probably near an edge location that serves you in single-digit milliseconds.
The slow quarter is somebody on a mid-range phone on a train with a cold cache. They are not an anomaly. They are the part of the measurement you cannot reach from your desk, which is also the part the score is built to tolerate.
Which is why “it is fine for me” is a true statement and not evidence of anything, and why a page can feel slow while every server metric says it is fast.
What a field score cannot do
Core Web Vitals as Google assesses them are field data: an aggregate over a population of real visits. That is what makes them worth having, and it is also the limit.
An aggregate cannot answer a question about one visit. When a specific person says the checkout was unusable on Tuesday afternoon, no percentile tells you what happened to them, and a page that passes tells you only that at least three quarters of visits were fine. The complaint is quite possibly from the quarter the threshold was designed to absorb.
Session Replay
Free Chrome extension. One click on the page that is misbehaving captures the screenshot, the console and the network log, and hands you a link to paste into the ticket.
So the two things do different jobs and neither substitutes for the other. The field score tells you whether the experience is broadly acceptable and where to spend engineering time. A captured visit tells you what happened to the person in front of you. Reaching for the first when somebody asks about the second is how a real report gets closed as not reproducible.
What to do with a slow complaint
Three steps, in the order that costs least.
Read the words for the metric. Waiting, unresponsive or moving. That alone picks which of the three to investigate and rules out the other two.
Get the one visit rather than the aggregate. When it happened, on what device and connection, and what the page was doing at the time. A percentile cannot be narrowed down to a person, but a captured session already is one.
Then check the field score, to find out whether you are chasing the tail or the middle. If the page passes and the complaint is real, you are in the designed-in quarter, and that changes the decision rather than ending it.
In one paragraph
Core Web Vitals are LCP at 2500 ms, INP at 200 ms and CLS at 0.1, assessed at the 75th percentile of loads and split between mobile and desktop, with FID retired in favour of INP. Each one maps to a complaint a person actually makes: waiting, tapping twice, or hitting the wrong button. And the percentile means a quarter of your visits are permitted to be worse than your passing score, which is why a green dashboard and an unhappy user are usually both correct, and why settling it needs one captured visit rather than a better average.