Somebody told you to “open the Network tab and see if any requests are failing,” and now you are looking at a panel full of rows, colours and columns that mean nothing yet. This is the shortest path from there to the answer they wanted.
The Network tab records every request the page makes: every image, every script, and every call your browser sends to a server to fetch data. When a page is broken in a way you cannot see - a button that does nothing, a list that will not load, a save that silently fails - the reason is very often one of those requests, and this is where it is written down.
Opening it
Chrome, Edge, Brave and the rest of Chromium. Press F12, or Cmd +
Option + I on a Mac. Developer tools open; click the Network tab along
the top. If you do not see it, it is behind the » overflow arrow.
Firefox. The same F12, then the Network tab.
Safari. The Network tab lives behind a menu that is switched off by default. Open Settings, go to Advanced, and tick Show features for web developers. Then Develop, Show Web Inspector, and the Network tab is there.
The panel is almost always empty when it opens, and that is the first thing that trips people up.
Why it is empty, and how to fill it
The Network tab only records while it is open. It does not remember what happened before you got there, so the requests that ran when the page first loaded are already gone.
So: with the tab open, reload the page. Everything the page fetches will scroll in as a list of rows. If the problem happens when you click something rather than on load, you do not even need to reload - just do the thing, and watch the rows appear as you do it.
One setting is worth turning on before you start: Preserve log (Firefox calls it the same thing). Without it, a page that redirects or reloads wipes the list, and the request you were chasing vanishes with it. With it ticked, the list survives, and you can see the request that happened just before the page changed.
Reading a row
Each row is one request. Left to right, the columns that matter:
- Name - the file or endpoint that was requested
- Status - the HTTP code that came back. This is the one you were sent here to look at
-
Type - what kind of thing it was: a document, a script, an image, or
fetch/xhrfor a data call - Time - how long it took
The colours are a shortcut. A red row is a request that failed. If somebody said “see if anything is failing”, you are looking for red, or for a status of 400 or above.
Click any row and a panel opens with the detail: Headers for what was sent and received, Response or Preview for what came back, and Timing for where the time went. For a failing request, Response is usually where the server’s explanation is.
What XHR means, because it is the filter you will be told to use
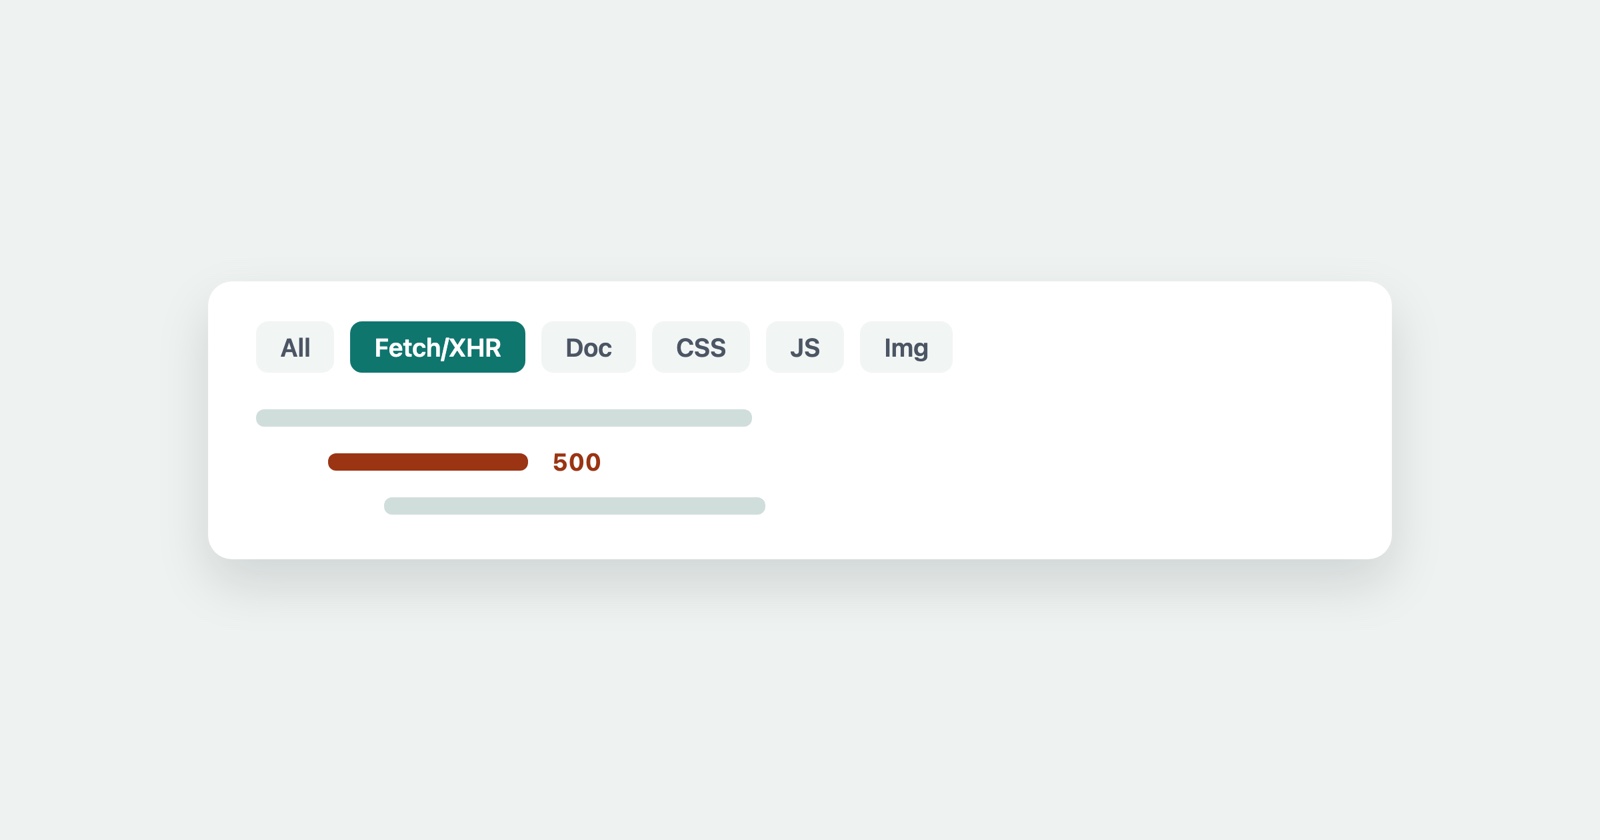
Along the top of the panel is a row of filters: All, Fetch/XHR, Doc, CSS, JS, Img. “Open the Network tab and filter to XHR” is a common instruction, and XHR is the least obvious word in it.
XHR stands for XMLHttpRequest. In practice it means a request your page made in the background to fetch data, without loading a new page - the modern web’s way of updating part of a screen without a full reload. When you type in a search box and results appear underneath, that is an XHR. When a “Load more” button adds items without the page flashing, that is an XHR.
The name is a historical accident - the original browser feature was built for XML, which almost
nobody sends any more; today these carry JSON. Its newer replacement is the fetch() function,
which is why the filter reads Fetch/XHR: two names, both meaning the same thing, a
data request rather than a page, an image or a stylesheet.
Clicking Fetch/XHR hides the images, scripts and fonts and leaves only the data calls, which is almost always where a broken feature’s failure is. A button that does nothing usually did send a request; it is right there, in red, with the reason in its Response.
Turning it into something you can send
Reading the Network tab yourself is one thing. The harder part is getting what you saw to the person who can fix it, because a screenshot of the panel loses the detail - the headers, the response body, the order - that actually explains the failure.
The tab can export the whole session as a HAR file: right-click any row and choose Save all as HAR with content. That is the network log as one file, which somebody can open in their own Network tab, or in the HAR viewer, exactly as if they had recorded it. Read that guide before you send one, though - a HAR usually contains your session cookies, and it should be treated like a password.
If the failing request is one that returns “TypeError: Failed to fetch” in the console with nothing useful in the Network tab, that specific case has its own explanation - it usually means the request never got far enough to have a status at all.
Session Replay
Free Chrome extension. One click on the page that is misbehaving captures the screenshot, the console and the network log, and hands you a link to paste into the ticket.
The network log it captures is the same list of requests you would have read in the tab, already saved and attached, so the person picking up the report does not have to talk you through opening it. For everything that goes around it - what you expected and what happened instead - the bug report guide has the template.