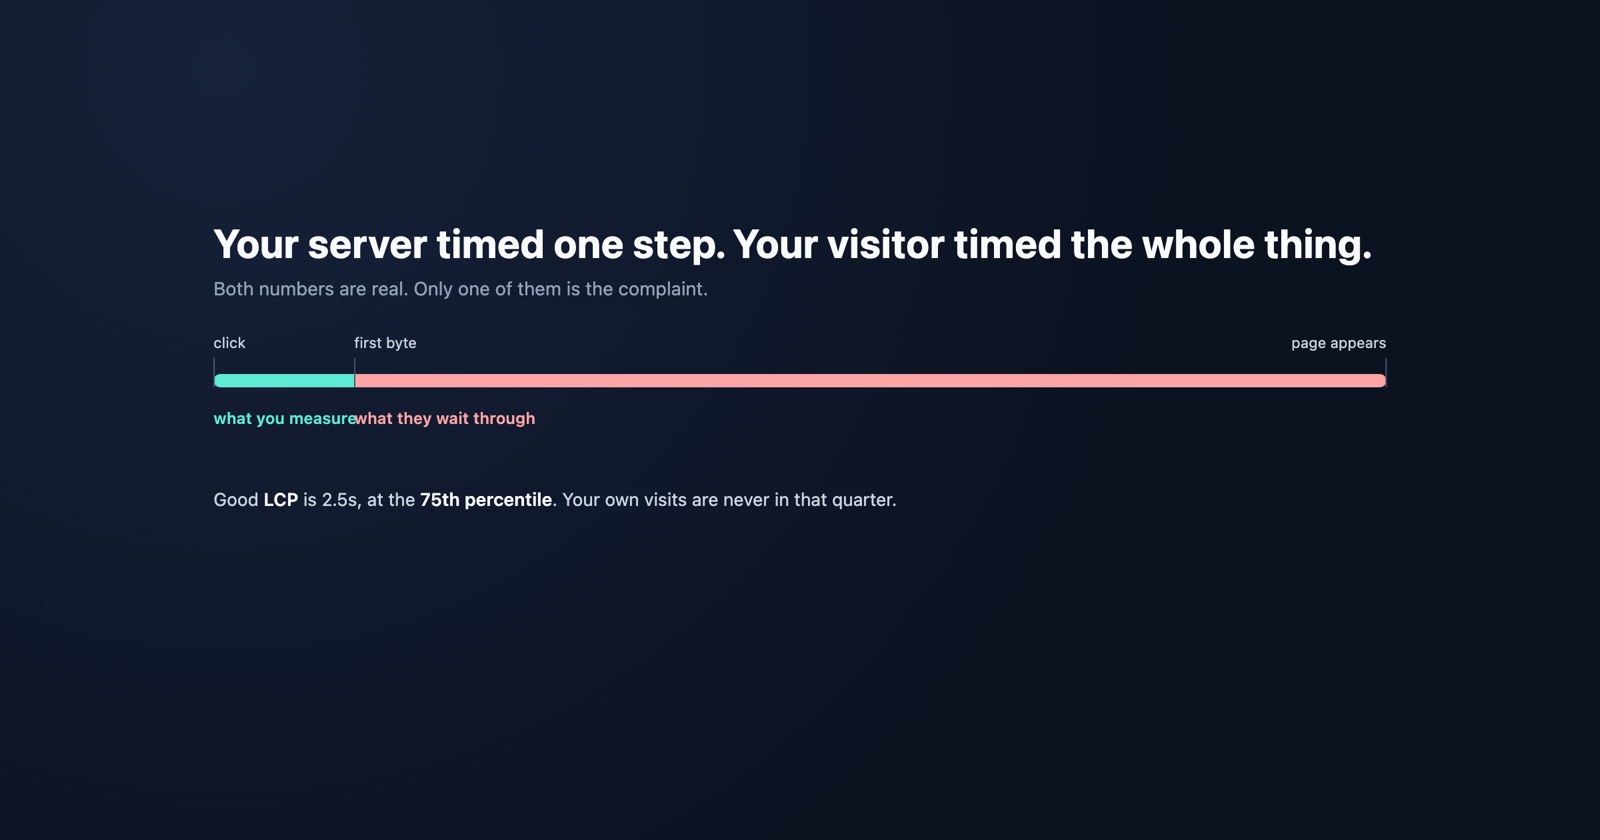
Somebody says your site is slow. You open the dashboard and everything is green. Response times in the low hundreds of milliseconds, no errors, no saturation, nothing above threshold anywhere.
Both of you are right, and the reason is not subtle once you see it: your server metrics and your visitor are timing two different things, and the overlap between them is smaller than almost anybody expects.
Two clocks, started at different moments
Your server’s clock starts when a request arrives and stops when it finishes writing a response. That interval is the one your monitoring reports, and it is a real measurement of a real thing.
The visitor’s clock starts when they click, and it does not stop until the page has drawn something they came for. Between those two moments sit: a DNS lookup, a TCP connection, a TLS handshake, your server’s work, the response travelling back, the HTML parsing, the stylesheets and fonts and scripts that HTML then asks for, each of which repeats most of the above, and finally the rendering.
Your server was involved in one step of that. A page can spend 80 milliseconds on your server and four seconds becoming useful, and nothing in your application monitoring is wrong when it says 80 milliseconds.
The number that describes the server, and the ones that describe the experience
The server-side number is Time to First Byte, which Google describes as measuring “the time between starting navigating to a page and when the first byte of a response begins to arrive”. Their guidance is that “most sites should strive to have a TTFB of 0.8 seconds or less”.
But they are explicit about its limits: “Because TTFB isn’t a Core Web Vitals metric, it’s not absolutely necessary that sites meet the ‘good’ TTFB threshold, provided that it doesn’t impede their ability to score well on the metrics that matter.”
The metrics that matter are the three Core Web Vitals, and each answers a question a person would actually recognise.
Largest Contentful Paint is when the biggest thing on screen finishes drawing, which is the closest machine proxy for “the page appeared”. The target is that “LCP should occur within 2.5 seconds of when the page first starts loading”.
Interaction to Next Paint is how long the page takes to visibly respond after somebody interacts with it: “pages should have a INP of 200 milliseconds or less”. It replaced First Input Delay as a stable Core Web Vital in 2024, and the change matters, because FID measured only the delay before processing began while INP measures the whole way through to the next paint. A page that accepted your click instantly and then froze scored well on the old metric.
Cumulative Layout Shift is not about speed at all. It measures how much the page moves around while loading, and the target is “0.1 or less”. It is on this list because a page that jumps under your thumb feels broken in a way that reads to the person as slow, even when nothing was.
The detail that resolves most of these arguments
Core Web Vitals are assessed at “the 75th percentile of page loads, segmented across mobile and desktop devices”.
Not the average. The 75th percentile, which means one visit in four is worse than the number you are looking at, and it is deliberate: an average is dominated by the people who were already having a good time. Your own visits are in that comfortable majority almost by construction, since you are near your servers, on a good connection, on a fast machine, with a warm cache.
So when a visitor says the site is slow and your dashboard says it is fast, the honest reading is not that one of you is mistaken. It is that you are looking at the mean of a distribution whose tail is the entire complaint.
- Weak
- "Site is slow." Checked the dashboard, p50 response time 90ms, closing as cannot reproduce.
- Better
- "Slow on the product page, about 6 seconds before anything appears, on mobile data." LCP is the metric; TTFB was fine, so the time is going somewhere after the response arrives.
Where the time actually goes
Once you accept that the gap is real, there are only a few places it hides, and they are the same few every time.
Render-blocking resources. The HTML arrived quickly and then asked for a stylesheet, and the browser will not paint until it has it. Every blocking request in the head is added to the time before anything appears.
Fonts. A web font that is not preloaded can leave text invisible or restyled well after the layout is otherwise done, which both delays the largest paint and, if it reflows, feeds the layout shift.
Images without dimensions. The single most common cause of layout shift. The browser cannot reserve the space, so everything below moves when the image arrives.
JavaScript, on a slow device. This one is invisible on a development machine by construction. Parsing and executing a large bundle costs a fraction of a second on a laptop and several seconds on a mid-range phone, and the page is unresponsive to taps for the whole of it.
The distance. A visitor on the other side of the world pays the round trip several times over before your fast server is even asked, which is the same reason a degradation upstream lands on you rather than on whoever caused it.
Session Replay
Free Chrome extension. One click on the page that is misbehaving captures the screenshot, the console and the network log, and hands you a link to paste into the ticket.
What to ask for instead of “can you be more specific”
“It is slow” cannot be acted on, but the three things that make it actionable are all easy to ask for, and none of them requires the reporter to understand any of the above.
- Which page, and what were they waiting for. Slow to appear at all, slow to respond after a tap, or moving around while it loaded. Those are three different metrics and three different causes.
- On what, and on what connection. A five-year-old Android on mobile data and a desktop on fibre are not the same site.
- Roughly how long, and whether it is always. The difference between “always about six seconds” and “sometimes it hangs” is the difference between a heavy page and an intermittent fault, and they share no fixes.
And the one that removes the guesswork entirely is a recording of the requests as they actually happened on their machine, because the network log shows where the seconds went rather than where you assume they went.
What to take from it
A green dashboard is not evidence that the site is fast. It is evidence that the part you instrumented is fast, and that part is one step in a sequence the visitor experiences whole.
Measure what they experience, at the percentile where the complaints live rather than at the average, and treat your own experience of your own site as the least representative data point you have access to.