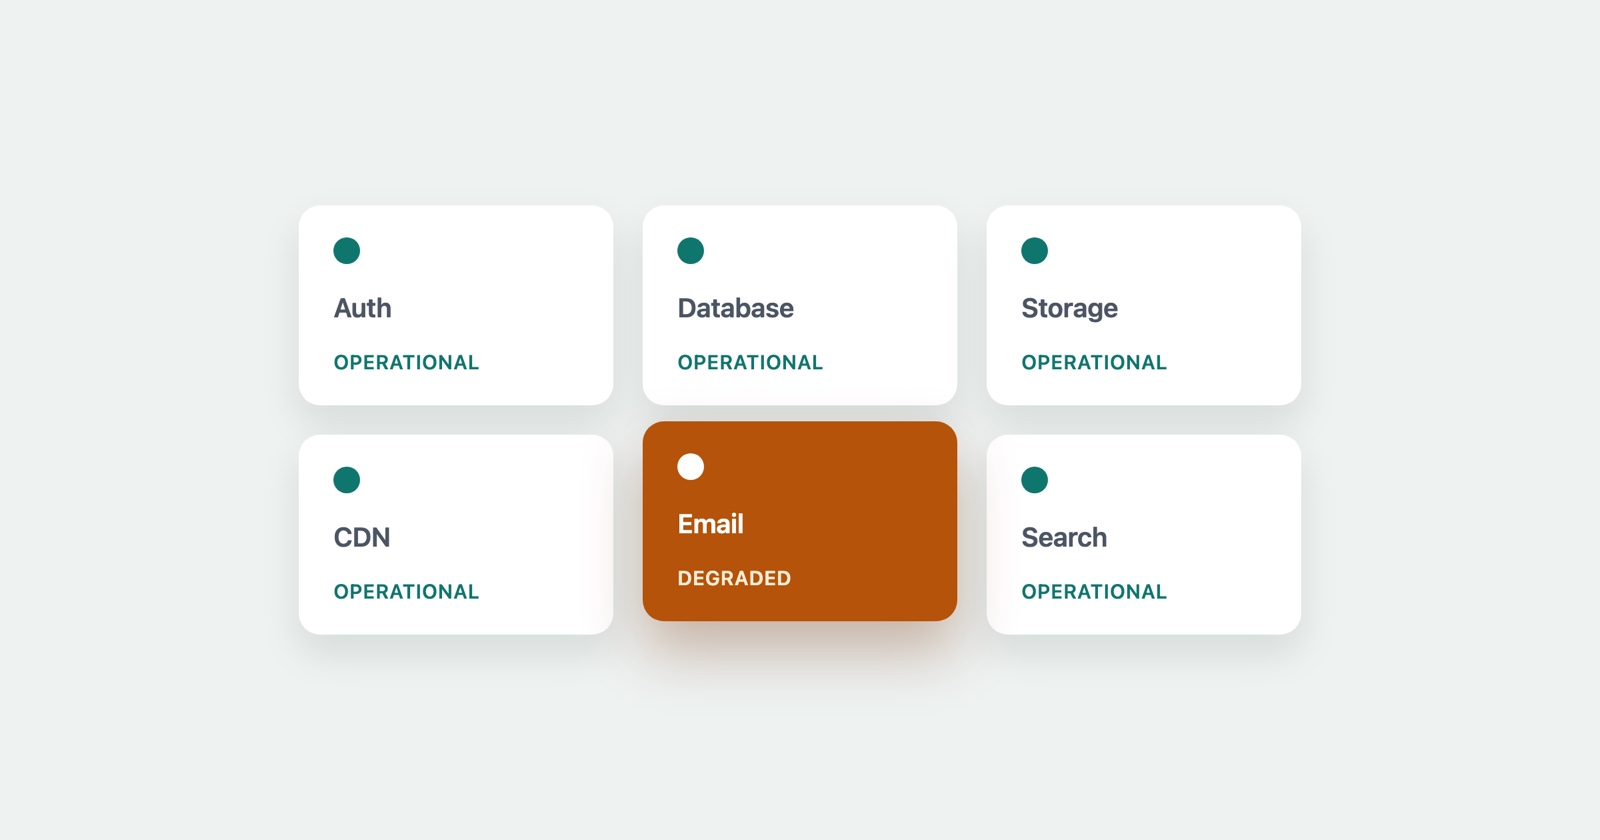
A little after midnight on 27 August 2026, the temperature in Proton’s main datacenter room in Frankfurt rose from 21.8°C to 51.9°C in under thirty minutes. A cooling system had failed, and network equipment that reached 105°C put itself into a protection mode that disabled it until a cold reset. Proton was down for about two hours.
What is worth reading is not that it happened - everybody’s infrastructure fails eventually - but the incident report Proton published afterwards, which is specific in a way most are not. It names the cause: an air-filter replacement on the redundant air compressors, carried out by the datacenter operator “in the middle of the night, without prior notice”, who “also failed to communicate the cooling failure when it happened”. It explains why recovery was slow rather than instant - the team chose to save hardware over restoring service quickly, because replacing it is hard “with the ongoing AI boom” straining supply. A postmortem that specific is a favour to everyone who runs anything, and it is worth saying so.
But there is a second thing in it worth the attention of anyone who receives bug reports, and it is easy to miss. The user-facing symptom was not a wall saying “Proton is down”. It was this, in their words: “No emails were lost, but email delivery in both directions was delayed.”
The failure that does not announce itself
A hard outage is the easy case. The site returns a 503, the page will not load, everyone understands within a minute that the problem is not theirs.
A degradation is the hard case. Something you depend on gets slow, or drops one request in twenty, or delays a delivery - and it stays up enough that nothing announces the fault. The symptom does not surface where the fault is. It surfaces in the next system along, which is very often yours, worn by a user who has no reason to suspect a datacenter in Frankfurt and every reason to suspect the app in front of them.
So the report you get does not say “my provider is having a cooling incident”. It says “your app is slow”, or “it didn’t send”, or “it worked this morning and now it doesn’t” - and you spend the first hour looking in the one place the problem is not, because that is where the person pointed.
Telling their outage from your bug, while it is happening
The distinction is usually visible in minutes if you know what to look at, and this is roughly the order.
Is it only the one dependency? A degradation upstream fails in a pattern: the requests that touch that service are slow or failing, and everything else on the page is fine. A bug of your own is rarely so tidy. Open the Network tab and watch which requests are red or slow. If they all go to one host and nothing else is affected, you are looking at somebody else’s afternoon.
What is the shape of the failure? A 504 Gateway Timeout is a server in front of another server that never answered - a specific fingerprint of an upstream that is up but not responding, which is exactly what a degradation looks like from outside. A request that hangs and then times out, rather than one that returns an error your code produced, points the same way.
Does the provider’s own status page agree? It often lags the incident by several minutes, so a green status page early on proves nothing - the failure reached you before it reached their dashboard. But once it turns, it settles the question. Check it, and check the timestamps against when your reports started.
Did anything of yours change? If you did not deploy, and the code that is now failing worked an hour ago and has not been touched, the thing that changed is more likely to be on the other end of the wire than in a file you can see.
The full version of this - the reasoning for each check and how to run it under pressure - is in Is It Your Bug or Their Outage.
What to capture so you are not arguing about it later
The trouble with an upstream degradation is that it is gone by the time anyone asks you to prove it was not your fault. The provider recovers, the status page goes green, the postmortem appears a week later, and what you have is a memory of a bad afternoon and no record.
So while it is happening, capture the evidence that ties the symptom to the outside: the failing requests with their status codes and timings, the timestamps, the response the upstream actually returned. That is the difference between “we think it was our provider” and a report with the 504s and the delivery delays sitting next to the provider’s own incident timeline. One is an argument; the other is closed.
Session Replay
Free Chrome extension. One click on the page that is misbehaving captures the screenshot, the console and the network log, and hands you a link to paste into the ticket.
The network log it captures is the record of exactly which requests failed and how long they took, saved at the moment it went wrong rather than reconstructed afterwards. When the question is whether the fault was yours or theirs, that log is what answers it - and it does not evaporate when the provider recovers.