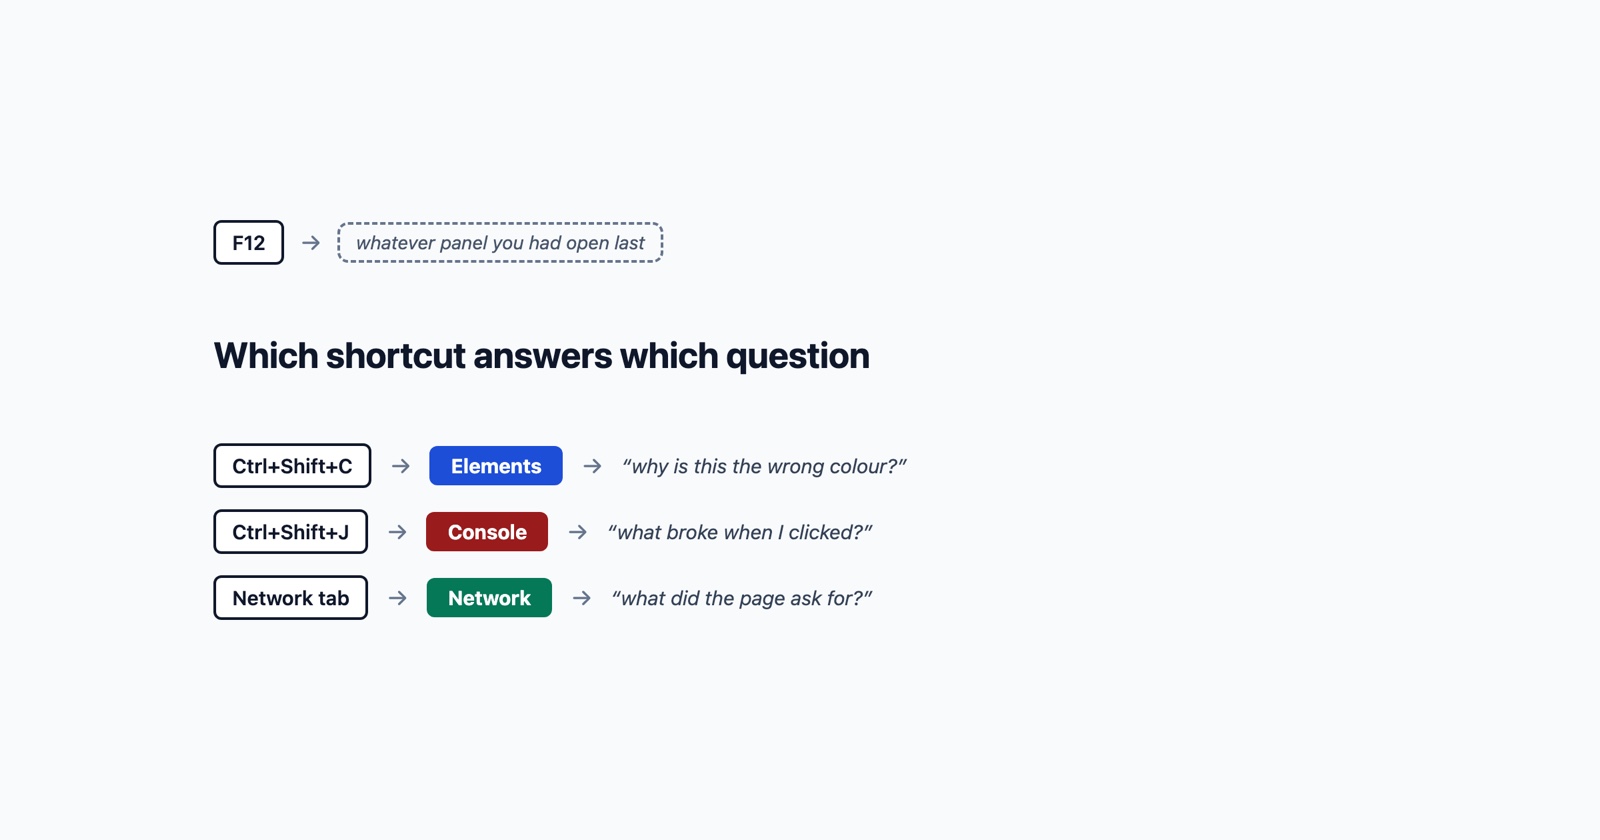
On Windows the answer is F12, and that is the whole of it. There is no menu to switch on first, no second device, no cable. Chrome, Edge and Firefox all open their developer tools on the same key, and unlike a Mac or an iPhone, there is nothing standing in the way.
Which means that if you are reading this, opening it is probably not what you are stuck on. The part that costs people an afternoon is what comes next: you were asked for something specific, the panel in front of you is not obviously it, and the tools do not tell you which of the eight tabs holds the answer.
Open it
Chrome and Edge, which are the same tools because Edge is built on Chromium:
-
F12orCtrl+Shift+Iopens whatever panel you used last. -
Ctrl+Shift+Jopens the Console directly. -
Ctrl+Shift+Copens Elements and turns on the element picker at the same time.
Firefox differs on one of the three:
-
F12opens the tools. -
Ctrl+Shift+Kopens the Web Console. -
Ctrl+Shift+Copens the Inspector with the picker on, same as Chrome.
Right-clicking anything on the page and choosing Inspect does the same as Ctrl+Shift+C, and
has the advantage of selecting the thing you right-clicked. On a laptop where the top row is set
to media keys, F12 may need Fn+F12; the Ctrl+Shift shortcuts avoid the question entirely.
The detail that wastes the most time
Read the first shortcut again: F12 opens whatever panel you used last. Microsoft’s own
documentation says exactly that, and Chrome behaves the same way.
So the single key everyone knows is the one that does not tell you where you will land. Somebody
who last used the Network tab presses F12, sees a wall of requests, and concludes that the
console is empty. The console is not empty. They are not looking at it.
This is why Ctrl+Shift+J is worth more than F12. It is the shortcut that means “the thing my
colleague actually asked me for”.
Which panel answers which question
The two requests that sound alike and are not:
“Inspect element” means the Elements panel. The question behind it is about what is on the page: why is this button the wrong colour, why is the text cut off, what is this div called. You are looking at the live HTML and the CSS applied to it.
“Open the console and tell me what it says” means the Console panel. The question behind it is about what went wrong while the page ran. Red lines here are JavaScript errors, and one of them is very often the reason the button did nothing.
They are different questions and they have different answers, which is why sending a screenshot of the Elements panel to somebody who asked about the console helps nobody.
The third one, which people are asked for less often and which answers more:
“Send me the network tab” means the Network panel, and it is about what the page asked for and what came back. Opening it and what XHR means is its own short guide, because it has a trap: it only records while it is open.
- Weak
- "I opened inspect element and I don't see anything wrong."
- Better
- "Console tab, two red lines: Uncaught TypeError: Cannot read properties of null (reading 'value') at checkout.js:214. Happens when I press Pay, nothing else on the page changes."
What to copy, and what not to
Once you have found the red line, the useful thing is the text, not a photograph of it.
Right-click a console message and you get Copy options. Copying the message text gives whoever asked something they can search their own code for. A screenshot gives them something they have to retype, and screenshots of consoles are usually cropped just above the file name and line number, which is the part that would have located it.
Two things worth including that people leave out:
- Expand the error first. A collapsed error shows one line. The arrow beside it opens the stack, and the stack is what points at where it happened.
- Say what you did. A console error with no action beside it is a fact without a cause. “It appears when I press Pay” turns it into something reproducible.
Session Replay
Free Chrome extension. One click on the page that is misbehaving captures the screenshot, the console and the network log, and hands you a link to paste into the ticket.
Two Windows-specific things worth knowing
A hard refresh is Ctrl+F5 or Ctrl+Shift+R. When somebody says “it works for me”, a stale
cached file is one of the ordinary reasons, and a hard refresh is the thirty-second way to rule it
out before anybody goes looking in the code.
Ctrl+Shift+P opens the Command Menu, which is a search box for every function in the tools.
If you know what you want and not where it lives, typing it there is faster than hunting through
panels, and it is the fastest way out of the “which tab was that on” problem the moment you have
more than three of them open.
What to take from it
On Windows, opening the tools was never the hard part. Knowing which of them was being asked for is.
Ctrl+Shift+J for the console, Ctrl+Shift+C for the element, and F12 only when you already
know where you left off. Then copy the text rather than photograph it, expand the error before you
copy, and say what you were doing when it appeared. That turns “I had a look and it seems fine”
into a report somebody can act on without a second conversation.