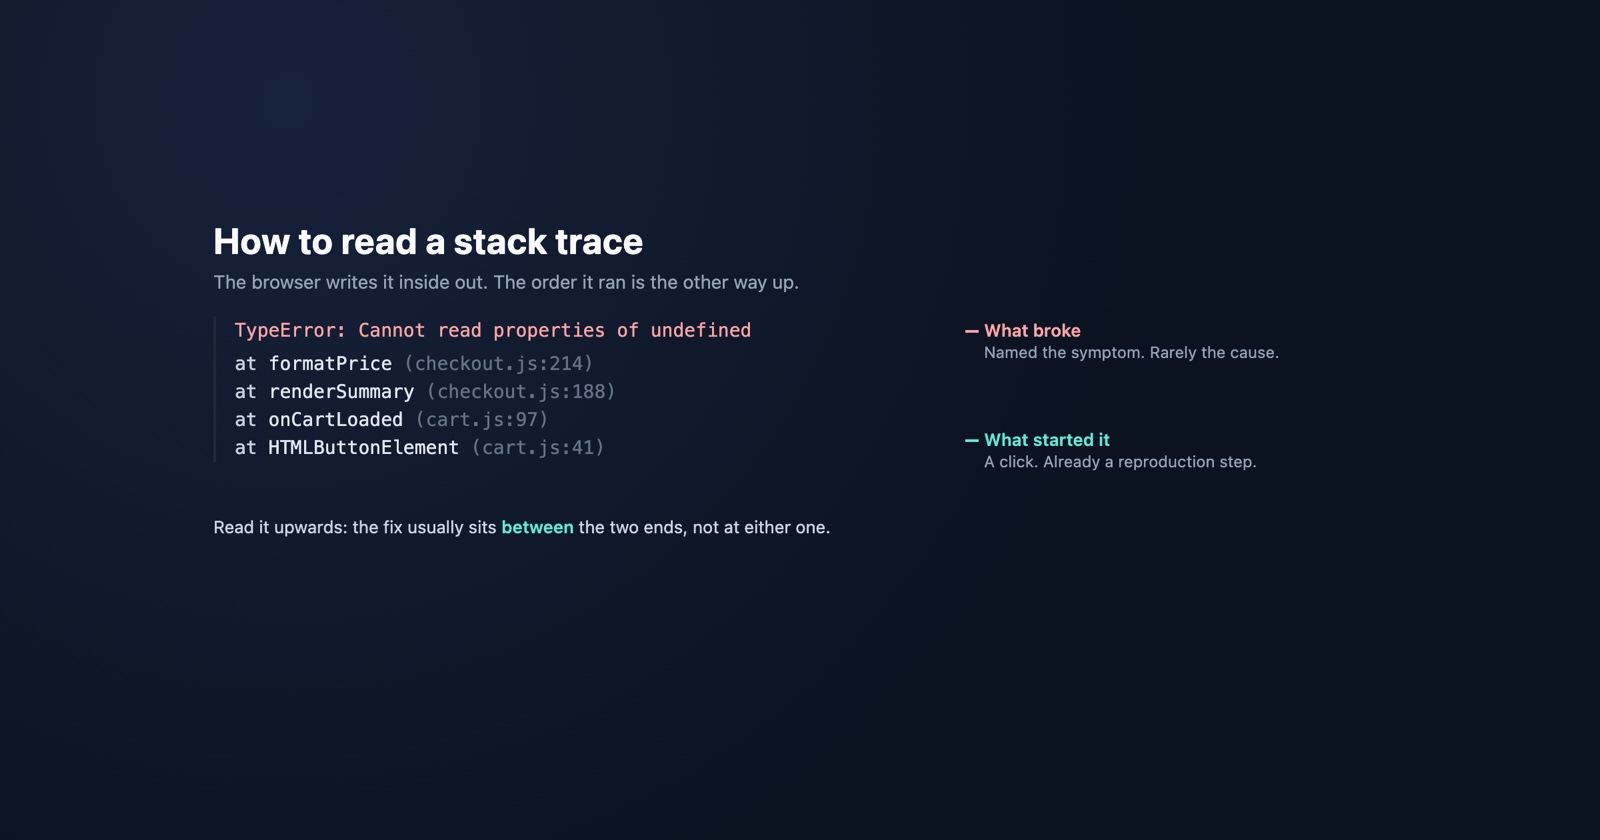
A stack trace is the list of function calls that were in progress when something threw. The browser writes it from the inside out: the function that failed on top, the one that called it below, and so on down to whatever started the whole thing.
It looks like a wall of text and gets treated like one. Most people read the first line, search the message, and never look at the rest, which is a shame, because the first line says what broke and the lines underneath say why anybody was there.
What the lines actually are
A browser trace looks roughly like this:
TypeError: Cannot read properties of undefined (reading 'total')
    at formatPrice (checkout.js:214:19)
    at renderSummary (checkout.js:188:7)
    at onCartLoaded (cart.js:97:5)
    at HTMLButtonElement.<anonymous> (cart.js:41:12)
Four things are in there, and each answers a different question.
The first line is the error: a type and a message. It says what went wrong at the moment it
went wrong, and it is the least useful line for finding the cause. In the example, something in
formatPrice tried to read .total from a value that was not there, which is the
undefined-property case
and almost never formatPrice’s fault.
Each at line is a frame: a function that was waiting for the one above it to return.
formatPrice was called by renderSummary, which was called by onCartLoaded.
The numbers are file, line and column. checkout.js:214:19 is line 214, column 19, which
matters when several calls sit on one line.
The bottom frame is the trigger, and it is usually the most informative single line in the
whole trace. HTMLButtonElement.<anonymous> means a click handler started this. Something a
person did, rather than something the page did on load. That is already a reproduction step.
Read it bottom to top
The habit worth building is to read the trace in the order the code actually ran, which is upwards from the bottom.
A click fired. onCartLoaded ran. It called renderSummary, which called formatPrice, which
found nothing where it expected a cart total. Read that way, the question stops being “what is
wrong with formatPrice” and becomes “what did onCartLoaded have in its hands, and where did
it get it?” That is where the fix almost always lives.
- Weak
- Error in formatPrice, line 214. Added a check for undefined.
- Better
- Click handler in cart.js:41 ran before the cart response came back, so renderSummary got an empty object. Fixed the ordering; formatPrice is unchanged.
The first version makes the error go away. The second makes the bug go away. They are not the same work, and the trace is what tells them apart.
The frames that are not yours
Most real traces are longer than the example and full of frames from libraries: React, jQuery, a bundler’s runtime, a polyfill. They are noise most of the time, and both major browsers will hide them for you.
In Chrome DevTools the feature is the Ignore list, under Settings, which collapses frames
from scripts you nominate and keeps the debugger from stepping into them. It already ignores
/node_modules/ and /bower_components/ by default, so the first useful move is often to add
your own vendor paths to it. Firefox’s debugger has the same idea, per file, as Ignore
source. Either way every trace afterwards is half the length.
What is left is your own code, which is the part you can change.
One exception worth keeping an eye on: if the only frames are library ones, the call probably came from inside that library rather than from your code, and the cause is usually the data or the options you handed it.
Why the trace sometimes points at nonsense
Three things routinely make a trace unreadable, and all three are properties of how the code was delivered rather than of the bug.
Minification. In production your code is one enormous line with one-letter names, so the
trace reads at n (app.min.js:1:84213). The line number is real and useless. The fix is source
maps: a build emits a .map file, the browser applies it, and DevTools shows the original
filenames and lines. Check whether yours are being generated, and whether the browser can reach
them, before concluding that a trace is beyond help.
Async boundaries. A trace stops where the call stack stops, and a setTimeout, a promise
callback or an event listener starts a new one. The frame that scheduled the work is not in the
trace by default. Chrome’s Async stack traces are on in DevTools and stitch the two together,
which is why a trace looks fuller in DevTools than the same error does in a log file.
Cross-origin scripts. If a script is served from another domain without permission to expose
its errors, the browser refuses to say anything about it at all: the message becomes the bare
string Script error., with no file, no line, and no trace. The fix is on the serving side,
Access-Control-Allow-Origin on the script plus crossorigin="anonymous" on the tag. Worth
knowing because the symptom looks like a mysterious error and is actually a permissions rule.
The trace you did not collect
Everything above assumes you have the trace. The awkward case is the one that matters most: the error happened on somebody else’s machine, in a browser you do not have, and what reached you is a sentence.
A stack trace is not something a user can be asked for. It lives in a panel they have never opened, it is gone when they close the tab, and the console does not survive a page navigation unless somebody thought to tick Preserve log first. So the practical choice is between having an error tracker or a report tool that captures the console at the moment of the failure, and doing without.
Without it, the report says “the checkout page went blank”, and the four lines that would have answered it in a minute were discarded by the browser seconds later.
Session Replay
Free Chrome extension. One click on the page that is misbehaving captures the screenshot, the console and the network log, and hands you a link to paste into the ticket.
Getting one on purpose
Two things are worth knowing for when you want a trace rather than waiting for one.
console.trace() prints the current call stack without throwing anything, which is the fastest
way to answer “who is calling this function?” in a codebase you do not know.
new Error().stack gives you the same as a string, which is what error trackers send home. It is
also how you attach a trace to a caught error that would otherwise vanish: catching an exception
and logging only e.message throws away the entire stack, and that habit is responsible for a
lot of unreadable production logs.
What to take from it
The top line names the symptom. The bottom line names what started it. The middle is the path between them, and the fix is usually somewhere along that path rather than at either end.
Read it upwards, hide the frames you do not own, and check your source maps before you blame the trace. And if the trace you need belongs to somebody else’s browser session, the time to arrange for it is before the bug, not after: by the time the report arrives, it is already gone.