A request failed. There is no status code, because no response ever arrived. And when you go looking in your access log for the request that failed, there is no line for it at all.
That combination is the signature of a failure below HTTP, and ERR_HTTP2_PROTOCOL_ERROR is the
most common way Chrome reports one. It is worth ten minutes because almost everything written
about it recommends the same workaround, and the workaround is a diagnosis that people mistake
for a cure.
What the code actually says
Chromium’s list of network errors, which is where these strings are generated from, defines it in six words:
There is an HTTP/2 protocol error.
That is the whole entry. The number is -337, and nothing in it names a cause, a direction or a party. Searching the string gets you a thousand pages guessing, because the source itself is guessing too.
The six that are not vague, and why that matters
Here is the part nobody mentions. Chromium does not have one HTTP/2 error. It has several, and every other one is specific:
-
ERR_HTTP2_SERVER_REFUSED_STREAM, -351, which the source describes at length: the server “refused the request without processing” and said so, either with aGOAWAYframe carrying error codeNO_ERRORand a Last-Stream-ID below this request’s stream, or aRST_STREAMwithREFUSED_STREAM. The comment adds the operational detail: “Client MAY retry (on a different connection).” -
ERR_HTTP2_PING_FAILED, -352: “HTTP/2 server didn’t respond to the PING message.” -
ERR_HTTP2_INADEQUATE_TRANSPORT_SECURITY, -360: “Transport security is inadequate for the HTTP/2 version.” -
ERR_HTTP2_FLOW_CONTROL_ERROR, -361,ERR_HTTP2_FRAME_SIZE_ERROR, -362, andERR_HTTP2_COMPRESSION_ERROR, -363.
So when you get -337 rather than one of those, you have learned something real: it was not a
refused stream, not a dead keepalive, not a cipher problem, not flow control, not a frame size,
not header compression. ERR_HTTP2_PROTOCOL_ERROR is the “none of the above” of HTTP/2, and the
above is six named things you can now stop investigating.
That is a smaller result than a cause, and it is much better than nothing, which is what the message on its own appears to offer.
Why your logs are empty
The reason there is no access log line is in the specification, and it is worth reading because it also explains why one user reports several things breaking at once.
RFC 9113 separates two kinds of failure. “A stream error is an error related to a specific stream that does not affect processing of other streams.” A connection error is the other thing entirely: “any error that prevents further processing of the frame layer or corrupts any connection state.”
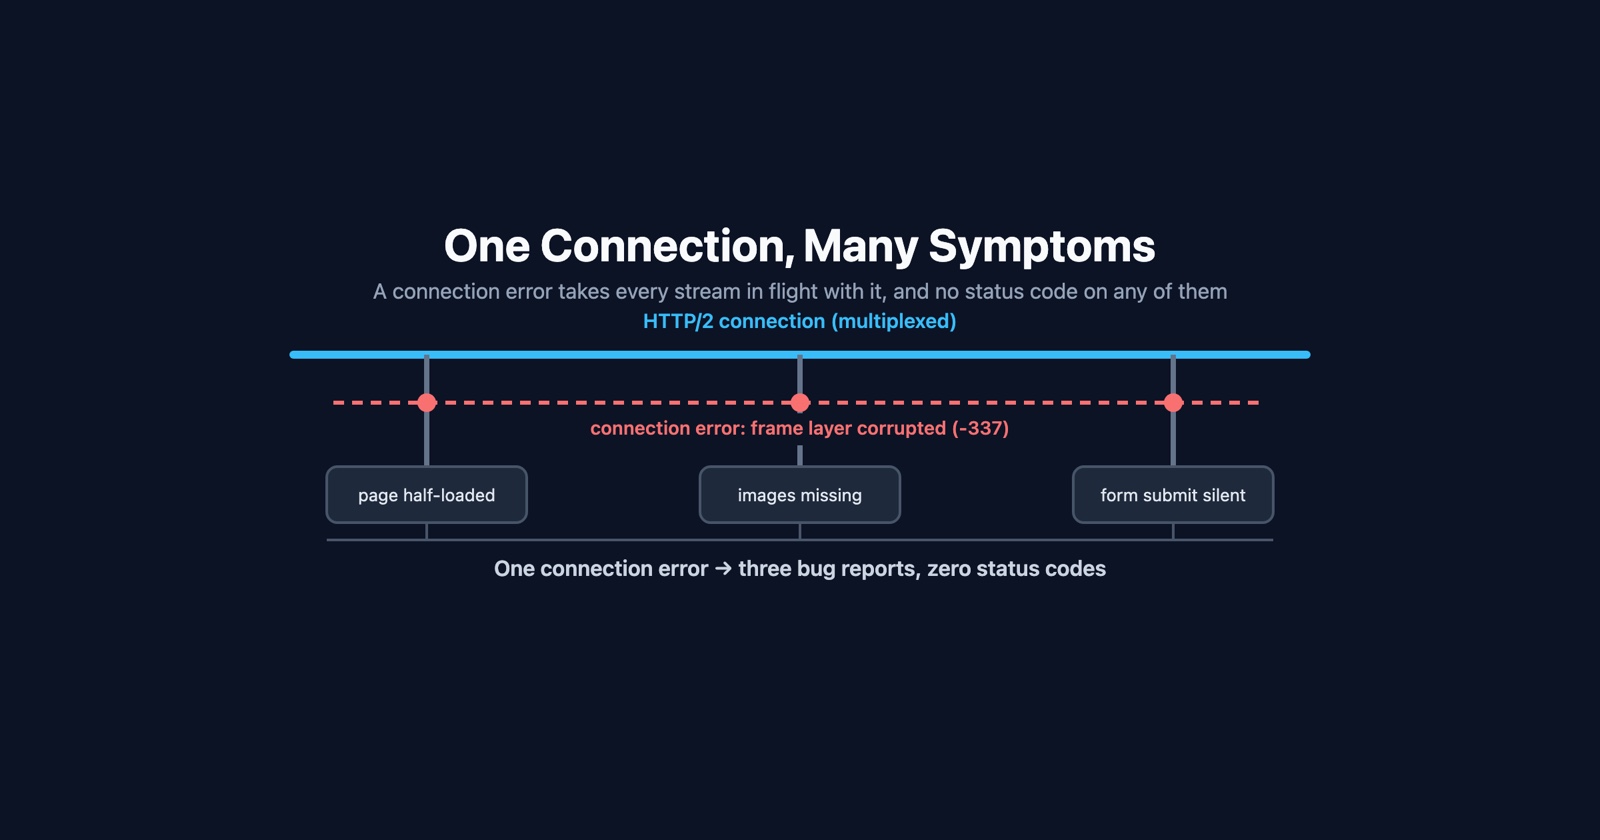
HTTP/2 multiplexes. One connection carries many requests at the same time, so a connection error does not fail the request that provoked it. It fails every request in flight on that connection.
- What the report says
- A page half loaded, some images are missing and one form submit did nothing. Three separate bugs, filed separately
- What happened
- One connection error took down everything in flight on that connection at the same instant. One cause, three symptoms, and no status code on any of them
And because the exchange never completed as HTTP, there is nothing for your server to log. No method, no path, no status. The user watched something fail and your logs show a gap where it should have been.
What is safe to retry, which the protocol does answer
This is the question that matters if a payment or a form submission was in flight, and it has a real answer rather than a shrug.
RFC 9113 says that “an endpoint that encounters a connection error SHOULD first send a GOAWAY
frame (Section 6.8) with the stream identifier of the last stream that it successfully received
from its peer.”
That identifier is a line drawn through the requests. Anything numbered above it was not received, which means it was not processed, which means retrying it cannot duplicate anything. That is precisely why Chromium’s own note on a refused stream says the client may retry on a different connection.
The catch is that this information exists for about a second, inside the browser, and then it is gone. It is not in your server log, because the frames that carried it are below the layer your server logs.
Session Replay
Free Chrome extension. One click on the page that is misbehaving captures the screenshot, the console and the network log, and hands you a link to paste into the ticket.
“Turn off HTTP/2” is a diagnosis, not a fix
The advice you will find everywhere is to disable HTTP/2 and see whether the problem stops. It is good advice and it is widely misread.
If the errors stop, you have learned where the fault lives: something in the HTTP/2 layer between that user and you is mishandling frames. You have not learned that HTTP/2 is unreliable, and you have not fixed anything. You have turned off multiplexing for every visitor in order to work around one party’s bug.
That party is usually not your server. The common causes are the things sitting in the middle: a reverse proxy or load balancer with its own HTTP/2 implementation, a CDN edge, corporate network equipment that terminates and re-establishes TLS, and security software on the user’s own machine doing the same thing. Each of those speaks HTTP/2 on your behalf, and each is a place a frame can be malformed without anybody on either end doing anything wrong.
Which is why this often affects one office, one ISP or one antivirus product, and nobody else.
What to ask the person who hit it
Two questions, and the second is worth more than it looks.
The exact string from the console or the error page. ERR_HTTP2_PROTOCOL_ERROR and
ERR_HTTP2_SERVER_REFUSED_STREAM are different problems with different answers, and a report
that says “a network error” has thrown away the only distinction that was free.
Does it happen on a different network? If it stops on mobile data, the cause is between them and you rather than on your server, and you have narrowed it to their network’s equipment in one question. This is the same test that separates a corporate proxy from a real certificate problem on the connection is not private screen, and it works here for the same reason.
What to take from it
The message is vague because the source is vague, and knowing that stops you reading meaning into it that is not there. What it does tell you is everything it is not, and six named alternatives is a real narrowing.
The rest follows from where the failure sits. It is below HTTP, so there is no status code and often no log line. It is a connection error, so it takes several requests with it and arrives as several bug reports. And the thing that would tell you whether a retry is safe is a frame the browser saw and your server never did.
Chromium’s list of these errors, with the one-line definition of each, is net_error_list.h, and the protocol itself is RFC 9113.