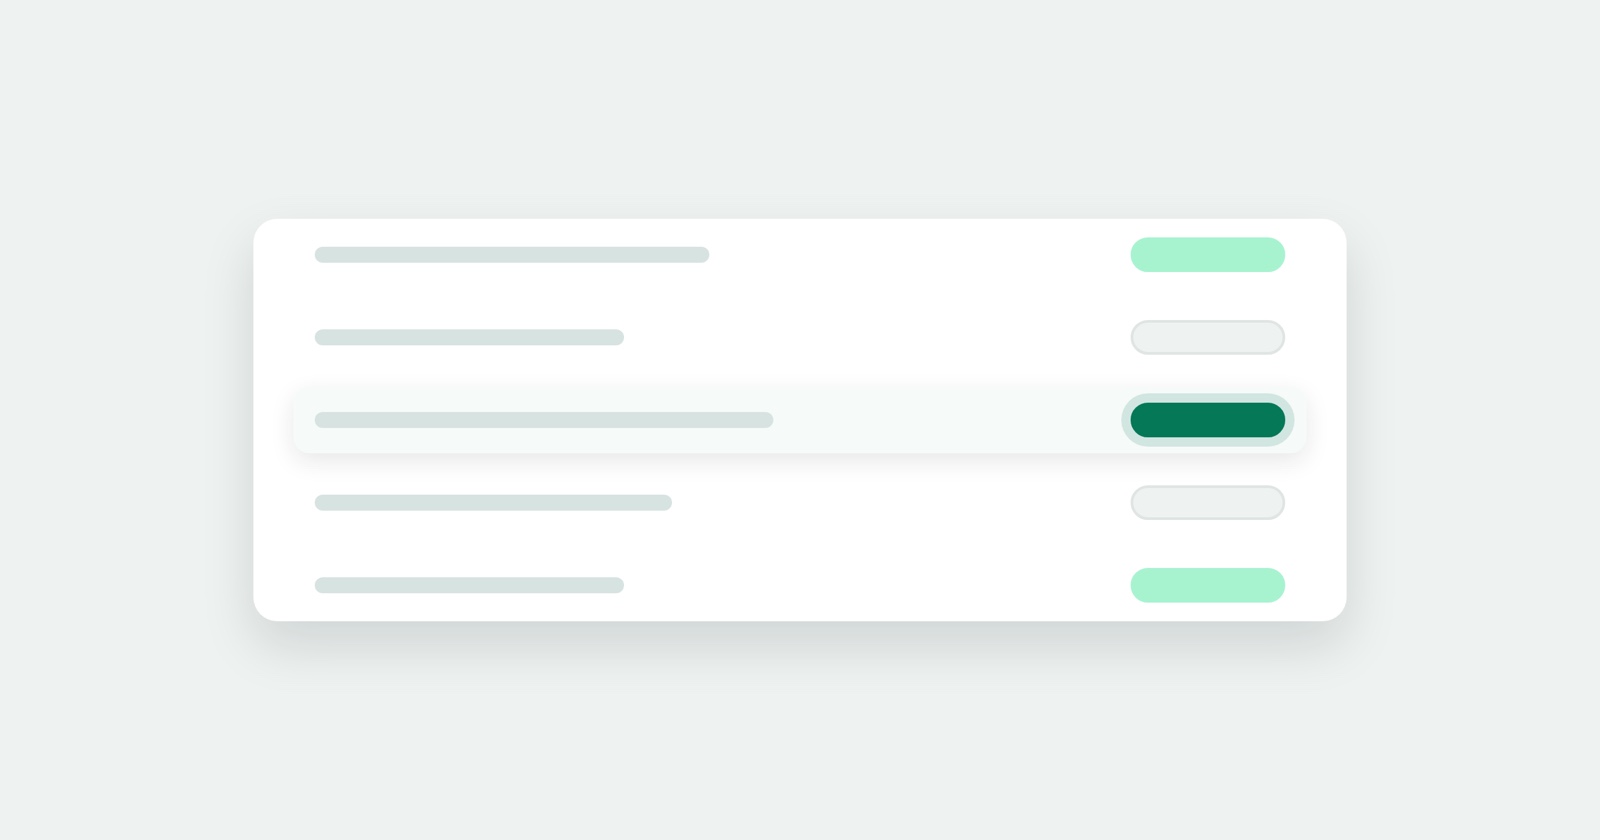
A report has carried a status since the day reports existed, and until yesterday nothing in the interface could change one. You could filter on it from three screens and set it only over the API, which meant every report sat at pending forever and the badge on the card was decoration.
The status control is now in the received reports list, in each card’s actions row beside the visibility control. Triage is a thing you do to a queue rather than to one report at a time, so it belongs where the queue is: read the card, set the status, move to the next one, never open anything.
Who may use it falls out of the scoping the screen already had. A report reaches your inbox because you are in the team that owns the domain it was filed against, so a report attributed to no site shows no control rather than one that refuses.
Sending a report to the developer who has to fix it
A private report opens for the team that owns the domain and for whoever filed it. The person it usually needs to reach is neither of those: the developer being handed the bug, who follows the link and is told the report does not exist.
The way round it used to be leaving team settings open in another tab and remembering the address. There is now an invitation on the report itself. It brings them into the team, because that is what reading a private report means here - there is no second access path and no link that grants access to whoever is holding it.
The recorder uses the whole plan
Last week’s note ended on an admission: every plan was selling a recording length its own upload limit refused, we had raised the server ceilings to match, and the recorder itself still stopped at a flat ten minutes for everybody.
Extension 1.5.0 went to the Chrome Web Store yesterday and closes that. The panel records for the length the plan sells - five minutes on free, ten on Starter, thirty on Professional - and both ends of the pipe now agree about the same number.
The same release fixes something that was worse than it looked. Every button inside the panel did nothing whenever the panel ran as its own window rather than docked: My Replays, the store link, the welcome page. Sign-in was the worst of them, because it waited for a tab that was never going to open and left the panel sitting on “Waiting for sign-in…” indefinitely. An installed web app is where a reader meets that first. Tabs now open into a real browser window from wherever the panel happens to be.
Session Replay
Free Chrome extension. One click on the page that is misbehaving captures the screenshot, the console and the network log, and hands you a link to paste into the ticket.
The MCP page now tells you what to type
The page shipped last week handed over the address and said authorization was OAuth 2.1 with PKCE. Both true, and neither one an instruction: the address goes somewhere different in every client, each signs in its own way, and a reader who had the URL was exactly where they started.
The connection step now carries one tab per client, each with the address in the place that client takes it and the command that authorizes it.
The last step changed for a related reason. It used to show three raw JSON-RPC envelopes and call them your first call, which taught the one thing a reader never needs - writing envelopes is the entire job of the agent you just connected - and asked for work nobody was going to do. It now shows five sentences to say out loud to the agent, built from your own newest report and your own verified domain. A team with no reports yet gets a plainer first sentence naming the domain instead.
There is also a public file at /agents/install.md now: the domain, the verification tag, both
load routes, the button markup, identify(), and what depends on the plan, served as plain text
with no sign-in. If the fastest route to a button on your site is handing the job to the coding
agent you already have open, that is the URL to give it. Being public, it holds nothing belonging
to any one site - the token is a bracketed placeholder and the file says to ask you for the real
one.
Three MCP tools that now fit in an answer
Worth writing down plainly, because the first version of each was wrong in a way that only showed up on a real report.
get_report returned the whole document. A thirty-two second recording came to 114,442
characters, of which the network log was 42,302 and its headers 22,947, which is past what a
client will accept in one tool result: the surface’s primary read tool could not read a report at
all. It now takes an optional sections argument naming any of network, console and
interactions. What you ask for comes back whole, minus the headers, cookies and query strings
that carry no signal the request URL doesn’t already carry. What you didn’t ask for is summarized.
set_status serialized the entire report back after changing one column, so a write that had
already landed was reported to the caller as a failure. It answers with a receipt now: the share
token, where the report stands, and when it was resolved.
get_frame takes a position in the recording, and nothing in the report document could name one.
Every entry carried an absolute wall clock and no offset, and a reader outside the application
could not derive the recording’s start from it, so in practice the offset was guessed against the
duration - which survives a short capture and nothing longer. The report now carries the offsets
the tool is asked for.
All five tools also state their action hints outright: the four reads are read-only, set_status
is not, and none of them is destructive. An omitted hint is not read as false by a client - it
falls back to the careful answer and asks a human before every read.
The console panel repeats itself less
Repeated console lines were collapsed only when they were errors. Everything else got a row per occurrence, which left the levels that repeat most as the ones expanded in full.
One report arrived with twenty-six console lines, of which twenty-two were the same third-party warning at debug level inside a single millisecond. On another, the one line that named the bug was the twenty-sixth. Lines are now grouped on level, message and URL together, at every level. Two frames failing the same way stay two entries, and the same words logged at two levels stay two entries.
Smaller things
- A team admin can rename their team. The name was written once at sign-up and never again, so anybody who signed up before filling in their name had a team called “someone@example.com’s team” permanently, and that is the name their colleagues read in the switcher.
- The dashboard is in the signed-in user menu, where people kept looking for it.
- The plan facts on the team page are one card instead of four.
- The flat error pages meet AA contrast, and the outline dark button is readable in dark mode.
- The web login is rate limited. It had been protected on the API and not on the sign-in form, against the same accounts.