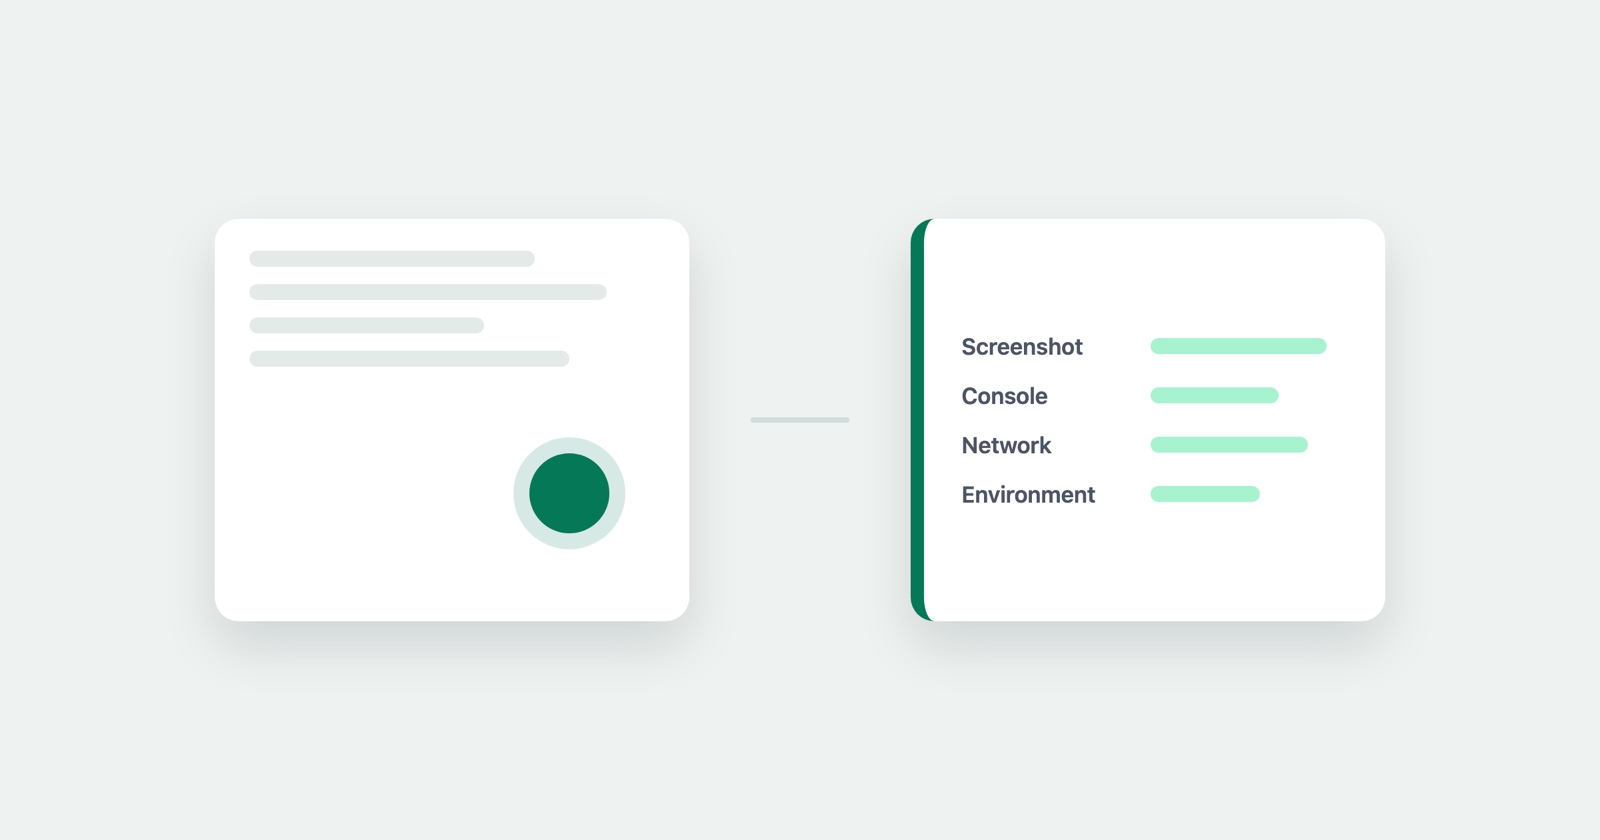
Everything a developer needs to reproduce a bug is on your screen while it is happening: the page, the console, the requests, the browser you are in. Ten seconds later the tab is closed and all of it is gone, which is why bug reports end up as sentences written from memory.
This is how to capture the whole thing instead, with the extension we build. It takes about a minute the first time and a few seconds after that. No account is needed to file a report.
Install it
Session Replay
Free Chrome extension. One click on the page that is misbehaving captures the screenshot, the console and the network log, and hands you a link to paste into the ticket.
Chrome and Chromium browsers, from the Web Store. Nothing to configure afterwards.
Capture the bug
Be on the page that is misbehaving, then click the extension icon in the toolbar.
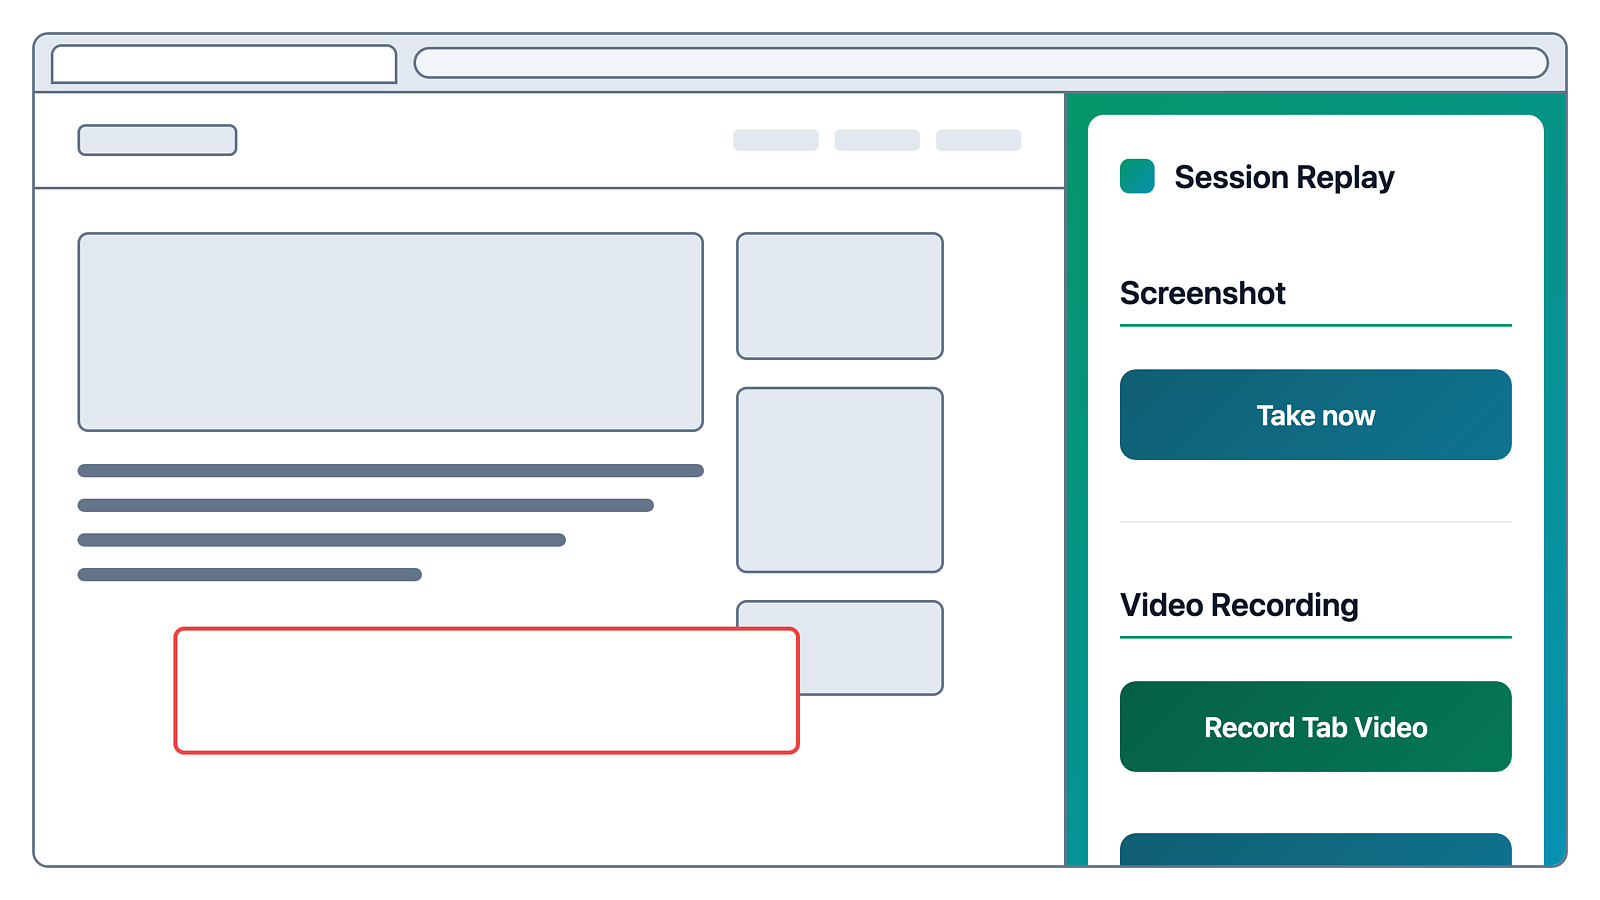
Choose a screenshot or a recording. A screenshot is right for anything you can see at once - a broken layout, a wrong total, an error message. A recording is right for anything with a sequence or timing in it: the button that works on the second click, the spinner that never stops. How long a recording may run belongs to the site it is filed on: five minutes on a domain nobody has claimed, ten on Starter and thirty on Professional. When the ceiling arrives the recording is finished and everything up to that point is kept, so a long one is never lost to a limit nobody mentioned.
Draw on the screenshot if it helps. Freehand, in whichever colour you pick. One circle around the wrong number saves a paragraph describing which number is wrong.
Add a description if you have one. Optional, and worth the fifteen seconds: what you expected to happen. That is the one thing the capture cannot know.
What gets captured without you doing anything
This is the part that makes the report worth reading, and none of it needs you to open developer tools:
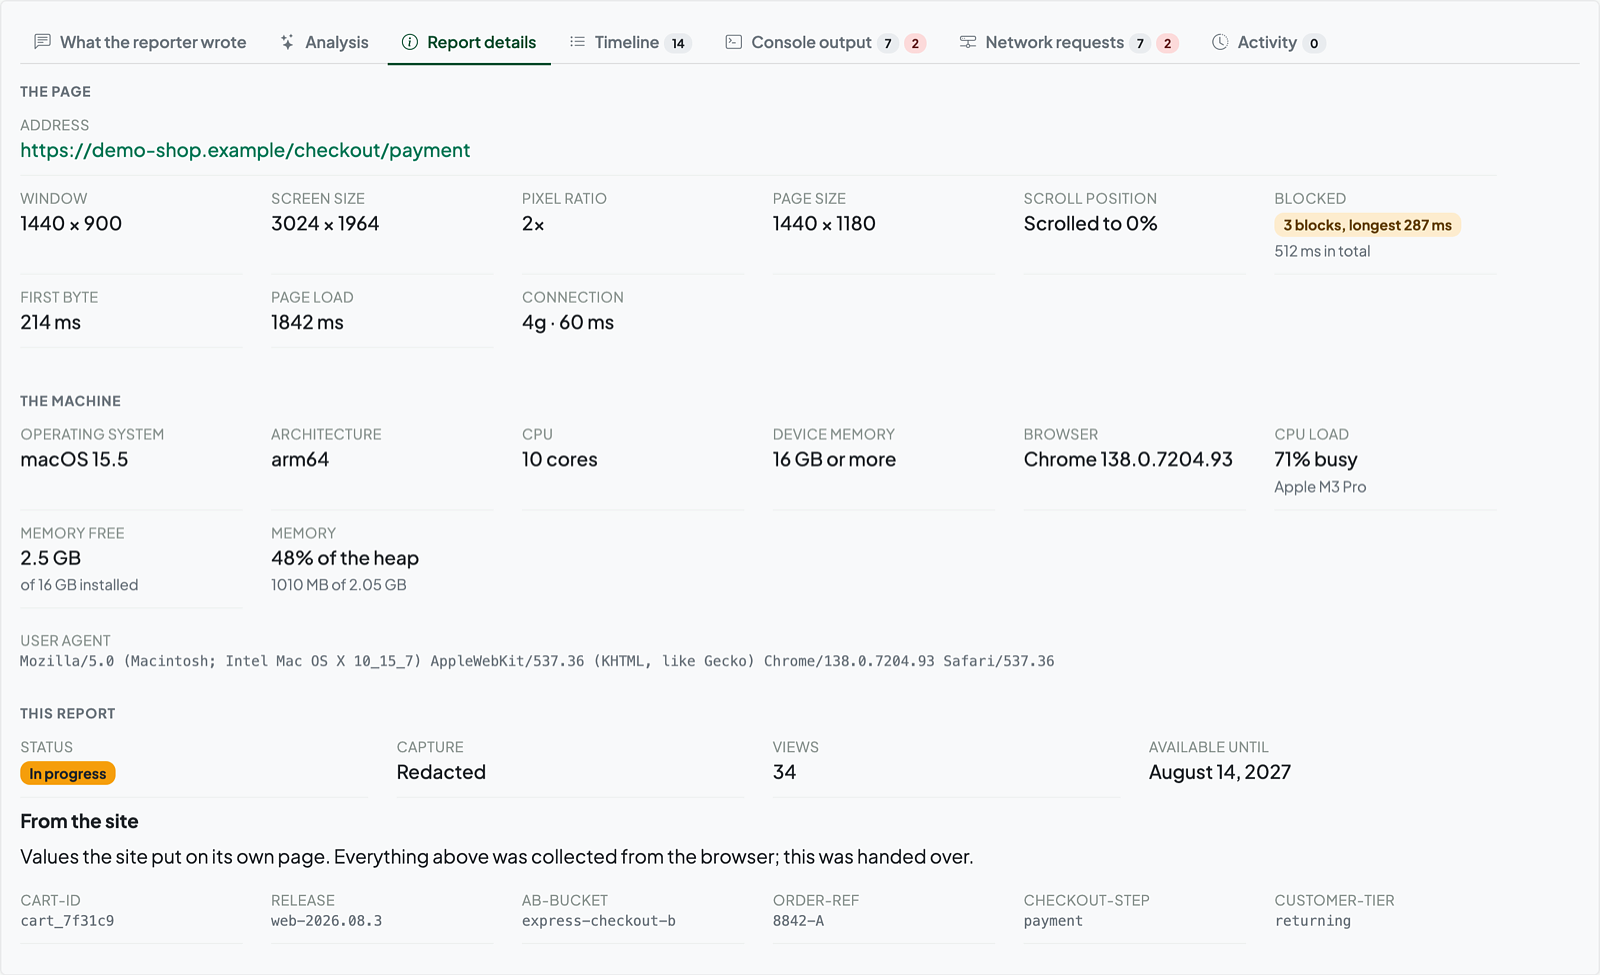
- Browser, version, operating system and screen size, which decide whether a defect is universal or yours
- Console output, including the error that was printed while nobody was looking
- The network log, with the status and timing of every request the page made - and a HAR file you can download and open in developer tools
- What you did: the clicks, form entries and page changes leading up to it, in order, which is what turns a report into reproduction steps
There is one thing to switch on deliberately. Tick the response bodies box before recording and the extension attaches Chrome’s debugger, so the report carries what the server actually sent back rather than only the request line. It is off unless you turn it on, and Chrome shows its own banner the whole time it is attached.
Share it
You get a link. Paste it wherever the work lives - the ticket, the pull request, the chat thread. Whoever opens it sees the capture and every tab of context beside it, without an account and without installing anything.
A share link is public by default. That is what makes it easy to send, and it is worth knowing before you capture a page with somebody’s personal data or an internal system on it. If you own the domain and are on a paid plan you can change that: reports can start private, visible only to the person who filed one and to your team, and any report can be flipped either way afterwards.
Create a free account if you want your reports to stay in one place with no daily limit, and to see when they have been opened. Filing one never requires it.
The part the tool does not do
A capture is evidence. It is not a report.
It does not know what you expected to happen, whether the two odd things you noticed are one defect or two, or how much this matters compared with everything else in the queue. Those are judgement, and they stay with the person who was there - which is why the description box is worth the fifteen seconds even though everything else is automatic.
If you want the shape of a report that gets fixed rather than queried, the bug report guide has it, and its template is a file you can keep beside your tracker. The ten most common mistakes are the same list from the other direction.
The short version
Install once. On the page that is misbehaving, click the icon, pick a screenshot or a recording, say what you expected, send the link. The browser details, the console, the network log and the sequence of what you did come with it, and the only part left to you is the judgement that was always yours.