How the category compares
An honest table across the tools people shortlist together, sourced from each vendor's own published pages and dated.
Capture the page once and send a link that carries the console output, every request the page made, the response bodies inside them and a first view of what went wrong.
One person sees it every time. Nobody else sees it at all. That is the bug this is built for.
A tester files it, a developer opens it on their own machine, and the page behaves. The screenshot is real and the steps are right, so the report is not wrong - it is just missing the part that was different about the machine it happened on. It gets marked as needing more information, and it comes back a week later unchanged.
What follows is a round trip that costs days. Which browser was it. Can you open DevTools and paste the error. What did that request come back with. Every one of those answers existed on the reporter's machine at the moment they pressed the button, and every one of them was thrown away when the tab was closed.
A deeper capture removes the round trip rather than shortening it. The console output goes with the report, along with every request the page made while the capture ran, the bodies those requests came back with when you have switched them on, and the browser, the operating system and the window size it all happened in. The developer opens one link and starts at the exception.
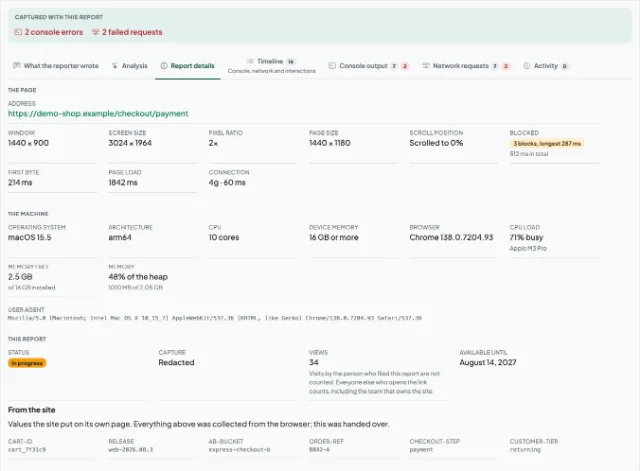
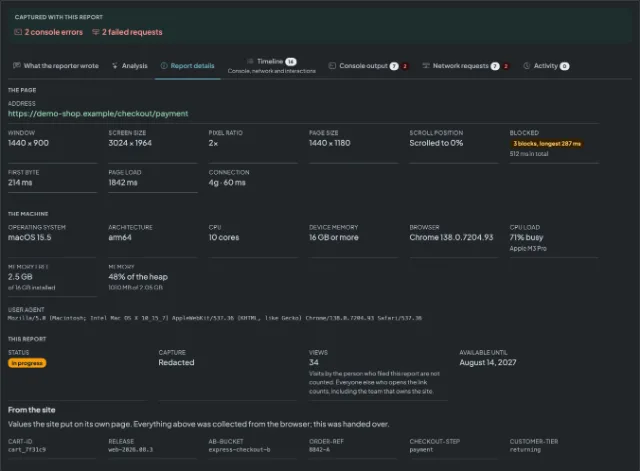
Collected around the capture, with nothing to fill in by hand.
Every request the page made while the capture ran, with method, status and timing, and the whole log downloadable as a HAR file to open in Chrome's own Network panel.
What the server actually sent back, not only the status it sent it with. Opt-in per recording, because a response body carries whatever the page was given, and capped by plan.
A model reads the whole capture the first time somebody opens the report and writes back steps to reproduce, a likely cause and a suggested severity, quoting the line it argued from. It can be wrong, and what was recorded sits beside it.
Errors and warnings from the page with their stack traces, so the reply to a report does not have to begin by asking somebody to open DevTools.
Browser and version, operating system, screen and window size. The four questions a reply usually opens with, answered before it is sent.
A report is a link. It opens for whoever you send it to, with no sign-in at either end, so a bug can be handed to somebody outside the team without seat maths.
A report does not have to be read in a dashboard. It can be pushed into the place your team already looks: Slack, Microsoft Teams, Jira Cloud, Webhooks, GitHub, GitLab, Bitbucket, Linear, ClickUp, Trello, Asana and Shortcut. What each destination does with a report, and what connecting it takes, is on the connectors page.
This captures a page deeply and hands you a link, which is where the comparison starts and also where it stops. So that it is a fair one:
Marker.io is a trademark of its owner. We are not affiliated with, endorsed by or connected to it.
An honest table across the tools people shortlist together, sourced from each vendor's own published pages and dated.
The same comparison against a tool built around a client feedback board rather than around the capture.
Install it, capture the bug once, and send a link that already answers what the reply would have asked.